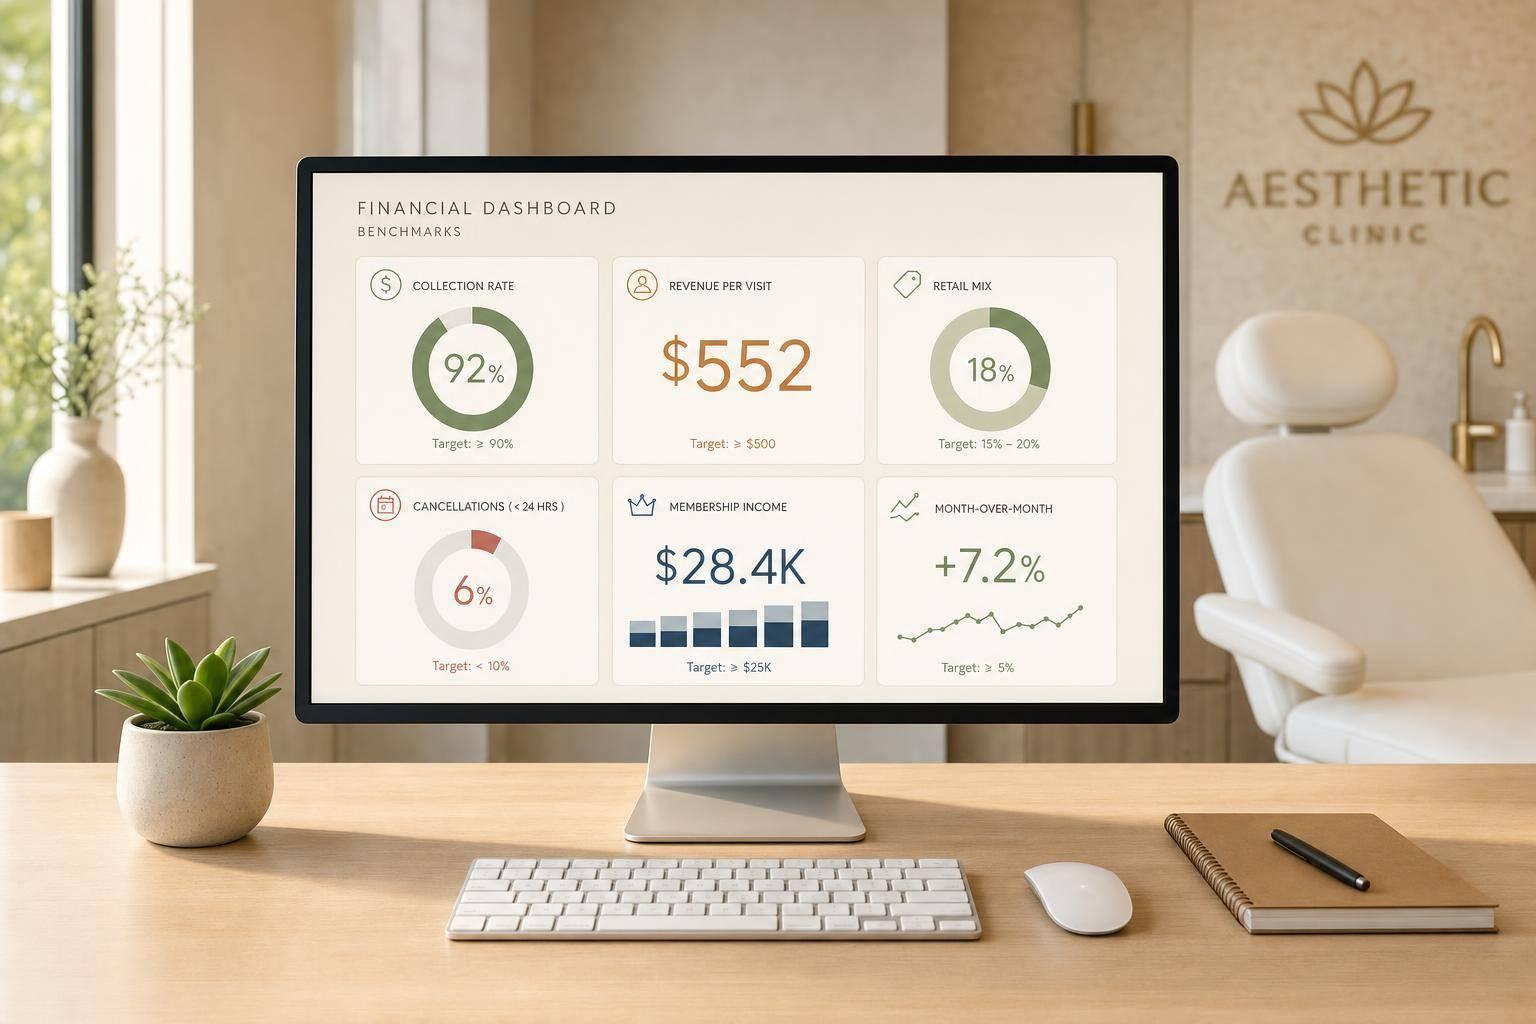

If I want a fast read on clinic financial health, I don’t start with revenue alone. I look at six numbers: collection rate, revenue per visit, retail mix, cancellation loss, membership income, and month-over-month trend lines.
Here’s the short version:
- Collection rate tells me how much billed revenue turns into cash.
- Revenue per visit shows what each appointment is worth.
- Retail mix shows how much revenue comes from product sales.
- Cancellation loss shows how much booked demand slips away.
- Membership income adds recurring monthly revenue that can smooth slow periods.
- MoM trends show whether these numbers are getting better or slipping.
The article’s main point is simple: growth only matters if it holds up after missed appointments, weak collections, thin retail sales, and churn are factored in. In the benchmarks shared, strong clinics often aim for things like retail mix at 10%–25%, cancellation rates under 5%, membership revenue around 14% of total revenue, and annual growth in the 8%–12% range.
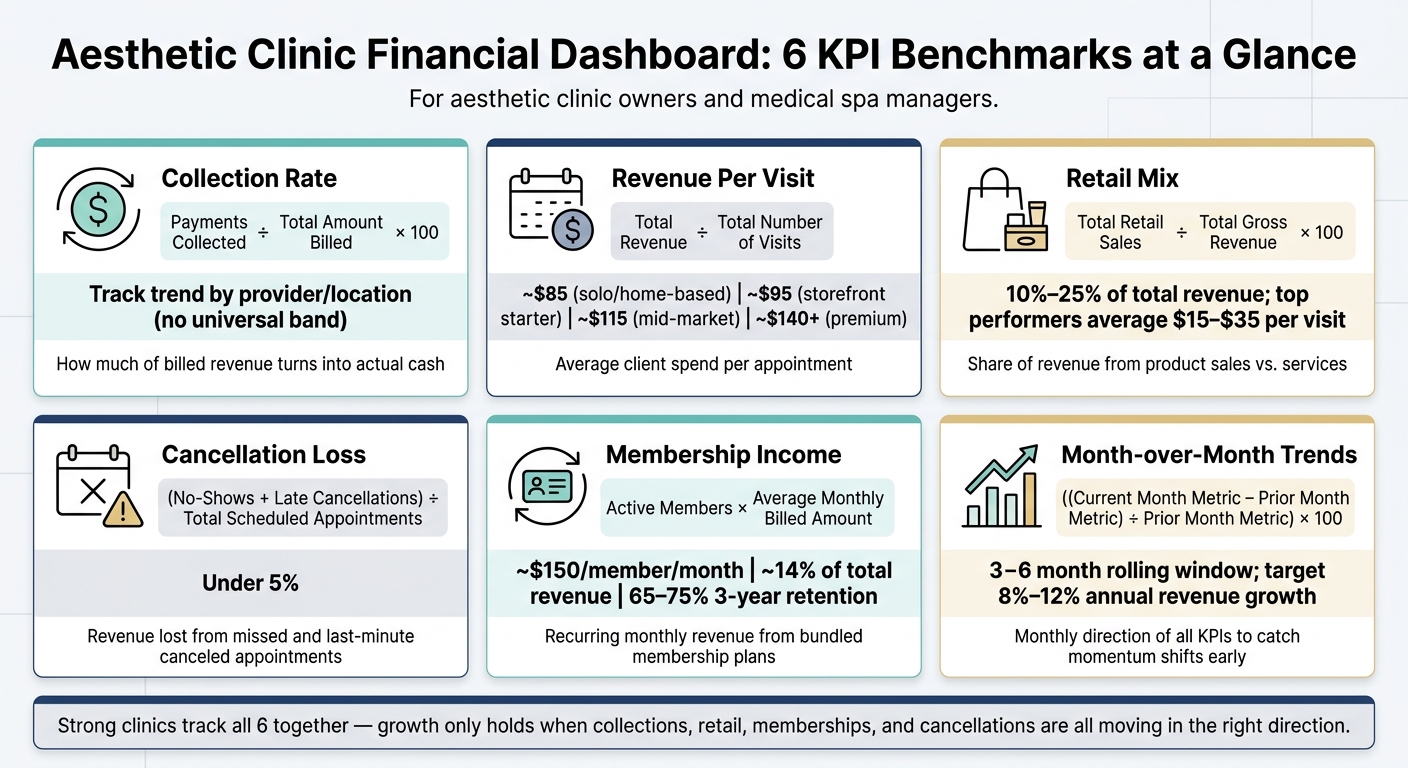
Aesthetic Clinic Financial Dashboard: 6 KPI Benchmarks at a Glance
Quick comparison
| KPI | What I check first | Common benchmark |
|---|---|---|
| Collection Rate | Cash collected vs. billed revenue | Track trend by provider/location |
| Revenue Per Visit | Average spend per appointment | $85–$140+ depending on clinic type |
| Retail Mix | Product revenue share | 10%–25% |
| Cancellation Loss | No-shows + late cancels | Under 5% |
| Membership Income | Recurring revenue per member | ~$150/month and 14% of revenue |
| MoM Trends | Monthly direction of each KPI | Use 3–6 months plus YoY |
What I like here is that the dashboard is not just a finance report. It works more like an early warning system. If one number drops, I can spot the issue before it shows up in total revenue.
sbb-itb-02f5876
1. Collection Rate
Collection rate shows how much of your billed revenue you actually bring in. The formula is simple:
Collection Rate = (Payments Collected ÷ Total Amount Billed) × 100
On its own, this metric only tells part of the story. You’ll get a better read when you look at it alongside leakage metrics like no-shows and late cancellations. That combo can help you spot revenue loss early.
If you’re comparing collection rates across providers or locations, make sure you’re looking at the right mix of revenue. Retail cross-sells can tilt the numbers when they’re grouped with service revenue, so it’s smart to track those two streams separately.
If your collection rate starts to dip, start with the usual suspects:
- No-show trends
- Cancellation patterns
- Late cancellation fees actually collected
Common fixes include keeping a card on file, asking for a deposit, sending automated reminders at 48 hours and 6 hours, and charging fees automatically when needed. An integrated platform can help run those steps without a lot of manual work.
It also helps to zoom out. Review collection rate over a 3–6 month window instead of judging it month by month. Payment timing and seasonal swings can make a single month look better - or worse - than it is.
Next, revenue per visit shows how well each appointment turns into income.
2. Revenue Per Visit
Revenue per visit - often called average spend - is the average amount a client spends in one appointment.
Formula: Revenue per Visit = Total Revenue ÷ Total Number of Visits
This metric shows appointment value, not cash collected.
Benchmarks can swing a lot by clinic type. The biggest reason is service mix. Injectables and laser treatments can bring in $300–$600+ per hour, while a signature facial usually lands around $90–$140 per hour.
| Clinic Type | Benchmark Revenue Per Visit |
|---|---|
| Lean Solo / Home-based | ~$85 |
| Storefront Starter | ~$95 |
| Mid-Market Clinic | ~$115 |
| Premium Clinic | ~$140 |
One thing matters here: compare revenue per hour, not just revenue per visit, when service lengths vary. A 30-minute laser session and a 60-minute facial might show the same per-visit number, but they do not perform the same on an hourly basis.
It also helps to track retail revenue per client on its own. If you roll product sales into everything, provider performance data can get muddy.
If revenue per visit is lower than expected, start with two checks:
- Look at your service mix
- Review your add-on attach rate
After that, look at retail mix to see how product sales affect the total.
3. Retail Mix
Retail mix is the share of your clinic’s total revenue that comes from product sales, not services. That includes skincare, post-care kits, and supplements.
Formula: Retail Mix = (Total Retail Sales ÷ Total Gross Revenue) × 100
This metric matters because small product sales can add up fast. Cross-selling and upselling can add 10%–25% to revenue per client, and high-performing clinics often bring in $15–$35 per visit from retail. The key is to figure out where that extra revenue is coming from: products, services, or both.
A good place to start is to compare retail mix by provider and treatment type. That helps you spot patterns that raw totals can hide. One provider may have strong service revenue but weak product sales. Another may do well with add-ons but miss post-care product sales.
Track these two metrics for each provider:
- Retail per client
- Add-on attach rate
Those numbers help you diagnose the actual issue instead of just repeating the result. If retail sales are low, the problem may be pricing, staff training, or inventory.
| Treatment Category | Retail/Add-on Potential | Notes |
|---|---|---|
| Signature Facial | High | Strong anchor for retail attach and memberships |
| HydraFacial | High | Visible outcomes drive product interest |
| Microneedling | Moderate | Strong fit for post-care kits |
| LED/Peel Add-ons | High | Margin boost with minimal extra chair time |
| Injectables | Moderate | Requires specific post-care retail recommendations |
Look at retail per client and add-on attach rate together to separate the root cause. Low attach rates usually point to training. Stockouts usually point to inventory. If your team is making solid recommendations but the shelves are empty, sales will stall either way.
Use integrated POS and inventory tracking to keep popular items in stock.
Once retail performance is clear, cancellation loss shows how much booked demand you actually keep.
4. Cancellation Loss
Cancellation loss is the revenue you lose from no-shows and late cancellations.
Formula: No-Show/Cancellation Rate = (Total No-Shows + Late Cancellations) ÷ Total Scheduled Appointments
Don’t just track the rate. Track the dollar loss tied to it too. That gives you a clearer picture of what missed appointments are doing to the business. Then compare the numbers across providers, service lines, and locations to see if the problem sits in one area or shows up across the board. It also helps to track cancellation rate next to fee collection as a short diagnostic check.
If the rate is high, use automated reminders, deposits, and a waitlist to cut down on open slots.
A platform like Prospyr can bring scheduling, reminders, payment processing, and analytics into one place.
Give this KPI one clear owner and one monthly target.
Next, membership income shows how recurring revenue can soften these swings.
5. Membership Income
After cancellation loss, recurring income is what helps steady the business. Membership income is the recurring revenue your clinic brings in from clients who pay a fixed monthly or annual fee in exchange for bundled treatments, discounts, and member-only perks. This kind of revenue helps smooth out booking swings.
Formula: Monthly Membership Revenue = Active Members × Average Monthly Billed Amount
To get a better picture, track two more numbers:
- Average Monthly Revenue per Member = Total Membership Fees ÷ Total Active Members
- Membership Revenue Share = (Total Membership Revenue ÷ Total Clinic Revenue) × 100
In strong aesthetic clinics, membership programs make up about 14% of total revenue, and top locations average $150 per member per month.
MRR and churn rate tell you if that membership revenue is steady and sticky. MRR gives you a predictable base for fixed costs. Churn shows whether clients feel the program is worth staying in. Strong programs usually keep 65% to 75% of members over a three-year period. It also helps to watch first-renewal conversion, because members who renew once often stay much longer.
| Metric | Benchmark Target |
|---|---|
| Monthly Revenue per Member | $150 |
| Membership Revenue Share | 14% of total revenue |
| Active Member Count | 800+ (top performers) |
| 3-Year Retention Rate | 65–75% |
| New-Member Acquisition Cost | $45–$90 |
If membership revenue slips below target, look at where things are going off track. Low enrollment usually means you need a better offer in front of more people. Seasonal promotions or referral programs can help, and acquisition cost should stay between $45 and $90 per new member.
If churn is high, the issue is often value or engagement. People don't stick around if the program feels easy to ignore. Personalized outreach and VIP events can help cut churn.
If enrollment looks healthy but revenue still feels soft, check the pricing mix. A program leaning too much on entry-level tiers at $50–$65/month will drag down average revenue per member when compared with premium tiers at $165–$200/month.
Also review failed renewals and expired cards. A simple billing issue can chip away at collected revenue. Automated billing helps protect that revenue.
Keep these membership metrics in plain view next to MRR and churn so weak renewals show up early. Prospyr includes membership management with automated renewals, payment processing, and analytics, so MRR, active member counts, and churn stay visible in one place.
Month-over-month trends show whether membership growth is picking up or starting to level off.
6. Month-over-Month Trends
Use MoM tracking to see if collection rate, revenue per visit, retail mix, cancellation loss, and membership income are moving in the right direction or starting to slip. This view helps you see which of the six benchmarks is pushing overall performance up or dragging it down. Month-over-month trend tracking means tracking monthly KPI changes to spot momentum shifts early.
The formula is simple:
MoM Change (%) = ((Current Month Metric − Prior Month Metric) ÷ Prior Month Metric) × 100
Look at MoM changes across a 3–6 month window. Then use YoY to tell the difference between an actual trend change and normal seasonality.
Comparing the current month with the prior month shows short-term momentum. Comparing it with the same month last year helps filter out seasonality. Summer months, in particular, can skew results, so YoY context gives you a cleaner read on whether performance is actually slipping.
| Comparison Type | What It Reveals | Signal of True Decline |
|---|---|---|
| Prior Month (MoM) | Short-term momentum | Decline beyond typical seasonal variance |
| Same Month Last Year (YoY) | Seasonality-adjusted performance | A result lower than the prior year |
| 3–6 Month Rolling Trend | Long-term trajectory | A consistent downward slope across metrics |
When a trend turns negative, find the benchmark behind the drop and act there first. That makes it much easier to catch the first metric that starts to weaken. As a broader benchmark, annual revenue growth of 8%–12% is a healthy target.
Each KPI on the dashboard should have a clear owner and a monthly target so action happens fast when a number falls. Prospyr keeps these trend lines visible in real time and supports quick email and SMS reactivation.
With this trend view in place, compare each benchmark side by side to find the weakest link.
Benchmark-by-Benchmark Analysis
Read each KPI from left to right. Start with what it measures, then check what good looks like, then decide what to fix first.
| KPI | Formula | Benchmark Band | Segment Notes | Action if Underperforming |
|---|---|---|---|---|
| Collection Rate | Payments Collected ÷ Total Amount Billed | No universal band; track your own trend by provider and location. | Shows how much of your billed revenue turns into cash. | Use card-on-file, require deposits for peak slots, and automate SMS reminders |
| Revenue Per Visit | Total Revenue ÷ Total Visits | $70–$125 (solo), $115 (mid-market), $140+ (premium) | Benchmarks shift by clinic tier and service mix. A solo clinic and a premium clinic should not use the same target. | Use basic/signature/advanced pricing tiers and add dynamic add-ons like LED or boosters |
| Retail Mix | Retail Sales ÷ Total Gross Revenue | 10%–25% of total revenue; high performers average $15–$35 per visit | Clinics that lean harder on retail usually aim for the top end of the range. | Train staff to recommend exactly one add-on tied to skin goals and one retail product for at-home care for every client |
| Cancellation Loss | (No-Shows + Late Cancellations) ÷ Total Scheduled Appointments | Under 5% | Track late cancellation fees collected to help offset the loss | Automate 2-way SMS reminders at T-48h and T-6h; require a card on file or deposits for peak slots |
| Membership Income | Recurring Subscription Revenue ÷ Total Revenue | ~14% of total revenue; ~$150 per member per month | Top clinics often keep 800+ active members per location | Introduce tiered plans ($50–$65/month entry, $165–$200/month premium) and 12-month minimum agreements; run seasonal enrollment pushes in January–March and December |
| MoM Growth | [(Current Month − Prior Month) ÷ Prior Month] × 100 | 3–6 month rolling trend; use YoY to filter seasonality and test whether the trend supports 8%–12% annual growth | Membership-heavy clinics tend to show steadier curves, while retail-heavy clinics can swing more month to month | Review a 3–6 month rolling window and isolate the KPI dragging the trend down first |
The dashboard below shows how these benchmarks work together in practice. This is where the numbers stop being abstract and start telling a story.
| KPI | Current Value | Prior Month | Benchmark Band | Status |
|---|---|---|---|---|
| Revenue Per Visit | $128 | $122 | $115–$140 | ✅ Healthy |
| Retail Mix | 18% | 14% | 10%–25% | ✅ Healthy |
| Membership Income | $152/mo per member | $148/mo | ~$150/mo per member | 🎯 On Target |
| Cancellation Rate | 4.2% | 5.5% | <5% | ⬆️ Improving |
| MoM Revenue Growth | 9.5% | 8.1% | 8%–12% | ✅ Healthy |
A few patterns stand out fast.
- Revenue Per Visit is at $128, up from $122, and sits inside the $115–$140 band.
- Retail Mix moved from 14% to 18%, which keeps it well inside the 10%–25% range.
- Membership Income is $152 per member per month, just above the ~$150 target.
- Cancellation Rate dropped from 5.5% to 4.2%, which pushes it back under the 5% line.
- MoM Revenue Growth climbed from 8.1% to 9.5%, staying inside the 8%–12% range.
That mix matters. One KPI can look fine on its own, but the full set gives you a better read on the business. For example, if revenue growth is up while cancellation loss is also climbing, part of that growth may be leaking out the back door. On the flip side, when visit revenue, retail mix, membership income, and cancellation control all move in the right direction at the same time, the clinic usually has a much steadier base to work from.
Pros and Cons of Using Benchmark Dashboards
Once the six benchmarks are set, the next step is simple: can your dashboard show them clearly and in real time? These numbers only help if the data behind them is current and correct. When that happens, KPIs stop being static finance reports and start acting like an early warning system. If collection rate drops or cancellation loss starts creeping up, the dashboard flags it before revenue falls further. It also helps to give each metric a clear owner and a monthly target so the numbers lead to action instead of just sitting on a screen.
There’s a catch, though. A dashboard is only as good as the data going into it. Manual spreadsheet reporting can still work for smaller clinics, but it comes with a clear downside: integrated systems are 3x less likely to have data entry errors compared with manual reporting. If scheduling, payments, and membership records sit in different tools, it becomes much easier for gaps to hide the issues you’re trying to spot.
| Approach | Advantages | Risks | Best Use Case |
|---|---|---|---|
| Manual Spreadsheet Reporting | Low cost; flexible for custom metrics | High error risk; time-consuming; data often outdated by the time reports are finished | Very small solo practices with low client volume |
| Integrated Dashboard (e.g., Prospyr) | 3x fewer errors; real-time visibility; saves ~16 hours on admin; combines scheduling, payments, and memberships in a single dashboard | Requires initial setup and staff training; monthly subscription costs | Growth-oriented clinics, med spas, and multi-provider practices |
| Hybrid Approach | Combines automated data with custom manual analysis for specific projects | Can create conflicting versions of the same metric | Established clinics performing deep-dive strategic audits |
One more issue tends to get overlooked: the dashboard itself usually isn’t the weak spot. The weak spot is how often the team checks it. Clinics that benchmark off a single snapshot can end up making pricing or staffing changes that look right in the moment, then fall apart once the trend settles back to normal.
Used this way, a dashboard doesn’t just show performance. It shows where the numbers start to crack.
Conclusion
Six benchmarks give an aesthetic clinic a clear financial snapshot: collection rate, revenue per visit, retail mix, cancellation loss, membership income, and month-over-month trends. Taken together, they show whether growth is paying off.
What matters most is how you compare them. Use MoM to track momentum and YoY to account for seasonality. Then use your best months as internal targets.
After that, it comes down to ownership. Keep a short set of KPIs, assign each one to a clear owner, and set monthly targets.
Built this way, the dashboard turns numbers into action.
FAQs
Which KPI should I fix first if several are underperforming?
Start with marketing campaign ROI. It shows how well your spend turns into collected revenue, so you can see which channels drive profit and which ones mostly drive volume.
Then look at your missed call rate. It’s often a major leak in the patient acquisition funnel, and it can quietly eat into growth if you’re not watching it.
Prospyr’s practice analytics can track both in one dashboard.
How often should I review my clinic dashboard?
For most aesthetic and wellness practices, a monthly review works best. Set a fixed date, like the 15th, to look at the previous month’s full data, compare the numbers against your budget, and dig into any variance above 10%.
A few metrics need a different rhythm:
- Review lead source performance and early program enrollments weekly
- Check accounts receivable twice a month
- Look at long-term trends and annual projections quarterly
Should I track retail and service revenue separately?
Yes. Track retail and service revenue separately.
Doing that gives you a much clearer picture of your clinic’s financial health.
It also makes it easier to measure key numbers like retail revenue per client and gross margin by service. That matters as you grow, because it helps you spot where margins are holding up and where they may be slipping.
Prospyr’s practice analytics can also show you which services and products are driving performance.