
If your clinic tracks only one thing, track inventory the same way every time. That one change can help cut stockouts, lower expired-product loss, and keep lot records ready for recalls.
Here’s the short version: this article breaks supply chain reporting into 5 report templates that cover the full path of a product in your clinic:
- Purchase Order Report for what you ordered and approved
- Receiving Log for what arrived, in what condition, and with which lot numbers
- Backorder Tracking Report for items that didn’t arrive in full
- Vendor Scorecard for measuring supplier performance over time
- Stock Movement Report for usage, transfers, waste, and write-offs
It also shows the main metrics to track, including:
- Inventory turnover
- Stockout rate
- Fill rate
- Purchase price variance
- Days of inventory on hand
- Supply expense as a % of revenue
A few numbers stand out. Medical supply spend often runs about 3% to 12% of revenue. A fill rate target of 93% to 98% is a common benchmark. And if a clinic carries $2,000 in extra stock and 30% expires, that’s a $600 loss.
The main point is simple: if you want tighter purchasing control, cleaner receiving records, fewer traceability gaps, and better reorder timing, these five templates give you a clear system to follow.
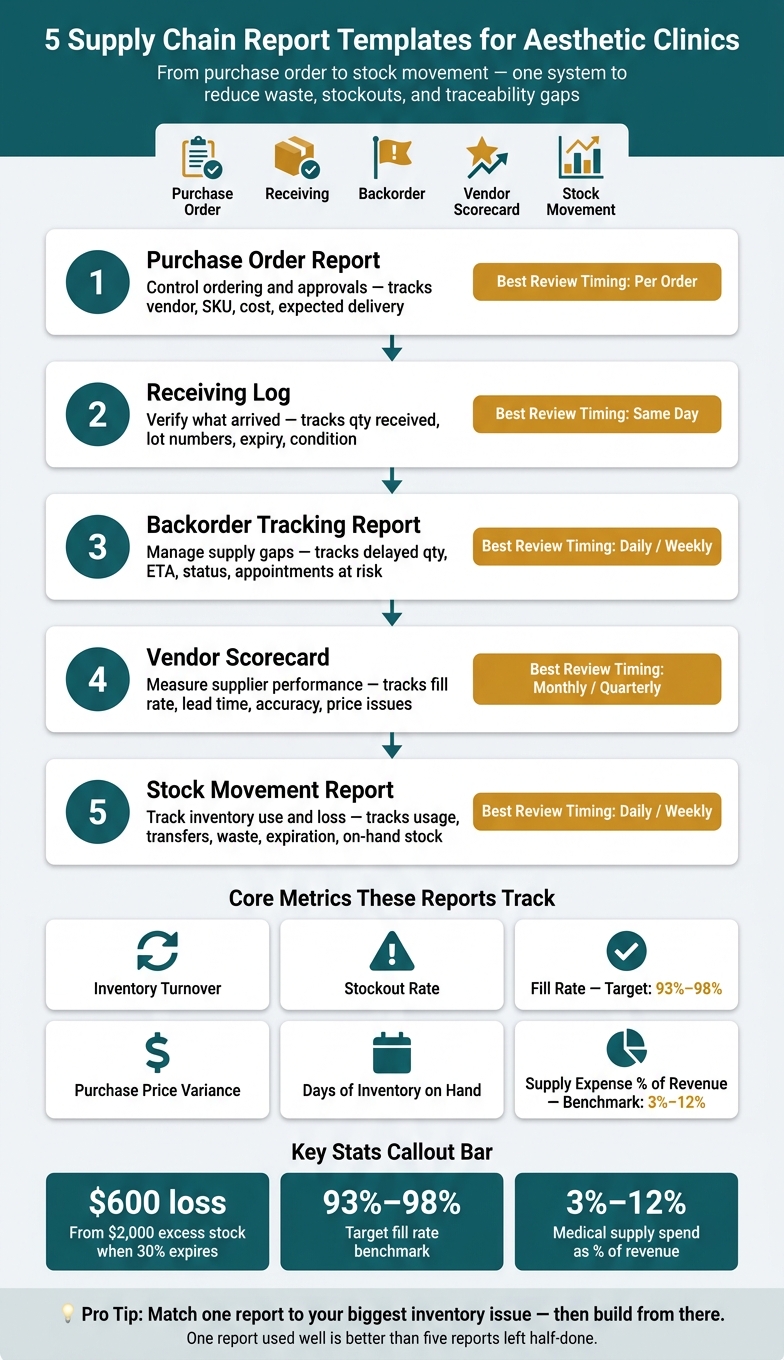
5 Supply Chain Report Templates for Aesthetic Clinics: At a Glance
Quick Comparison
| Template | Main Job | What It Tracks | Best Review Timing |
|---|---|---|---|
| Purchase Order Report | Control ordering and approvals | Vendor, SKU, cost, expected delivery | Per order |
| Receiving Log | Check what arrived | Qty received, lot, expiry, condition | Same day |
| Backorder Tracking Report | Track missing items | Delayed qty, ETA, status, affected appointments | Weekly or daily for critical items |
| Vendor Scorecard | Measure supplier results | Fill rate, lead time, accuracy, price issues | Monthly or quarterly |
| Stock Movement Report | Track inventory use and loss | Usage, transfers, waste, expiration, on-hand stock | At point of use, then daily/weekly review |
If you’re trying to fix supply problems in an aesthetic clinic, this article gives you a simple way to start: match one report to your biggest inventory management issue, then build from there.
sbb-itb-02f5876
Why Standardized Supply Chain Reports Matter in Aesthetic Practices
Standardized templates turn day-to-day supply activity into data you can actually use. They make it easier to track what was ordered, what arrived, what got used, and what ended up wasted. Each template records one part of that chain.
The money side matters too. In U.S. practices, medical supplies usually account for about 3% to 12% of revenue. That makes supply spend one of the clearest cost areas a clinic can control. If that share starts climbing, standardized reports help pinpoint the cause. Is it vendor price increases? Too much ordering? Product loss from expired stock? Without consistent reporting, you're guessing.
Key Inventory Risks in Aesthetic Clinics
The biggest risks in aesthetic clinics are stockouts, expired products, missing lot numbers, receiving mistakes, and too much retail inventory. In most cases, those problems start with incomplete or uneven recordkeeping.
Standardized reports make these issues easier to spot. Stockouts, product expiration, and missing lot data show up fast when the same fields are tracked every time. For example, if a clinic is sitting on $2,000 in excess stock and 30% expires, that's a $600 loss.
Missing lot numbers create traceability gaps, and that can turn into a major liability during a recall or after an adverse reaction. Receiving errors - like the wrong quantity or the wrong unit of measure - throw off inventory counts and weaken financial reporting. The pattern here is simple: if the clinic doesn't track the same metrics every time, these failures stay hidden.
Core Metrics These Reports Should Track
Six metrics give clinics a steady read on supply chain performance. But they only help if the data behind them is collected the same way every time.
| Metric | What It Measures | How It's Calculated |
|---|---|---|
| Inventory Turnover | How efficiently stock is used and replenished | Annual supply COGS ÷ Average inventory value |
| Stockout Rate | How often a needed item is unavailable | Stockout events ÷ Total demand occasions × 100 |
| Fill Rate | How many requested units arrive on time | Units supplied on time ÷ Total units requested × 100 |
| Purchase Price Variance (PPV) | Whether you're paying more or less than expected | (Actual unit price − Standard unit price) × Quantity purchased |
| Days of Inventory on Hand (DIO) | How long current stock will last at current usage | Current inventory value ÷ Average daily usage |
| Supply expense as a % of revenue | Whether supply costs are in line with revenue | Total supply cost ÷ Total clinic revenue × 100 |
Healthcare supply chain benchmarks set an order fill rate target of 93% to 98% and treat a stockout rate above 2% as a signal that reorder points or forecasting need work. Put together, these metrics show whether purchase orders, receiving logs, backorder tracking, vendor scorecards, and stock movement reports are operating as one system or drifting apart.
Once a clinic tracks these measures in a consistent way, the reports become useful for forecasting and purchasing - not just recordkeeping.
How Standardized Reports Improve Forecasting and Purchasing Controls
Consistent templates make month-to-month and season-to-season comparisons dependable. If neuromodulator usage jumps every November and December, stock movement reports will show that pattern. That gives the clinic time to increase its October order before a shortage hits, not after.
On the purchasing side, standardized reports bring price creep and over-ordering into plain view. Purchase price variance can flag cases where a vendor charges above the contract rate or where staff buy from non-preferred suppliers at a higher cost. Days of inventory on hand reports can also spot slow-moving items before they expire, which gives the clinic a chance to cut order quantities instead of writing off dead stock.
The point is simple: tighter control over ordering, pricing, stock levels, and replenishment timing helps keep treatment availability steady and supply costs predictable.
Each template closes one gap in that chain, starting with purchase orders. Purchase orders are the first control point because they define what should arrive before anything is received or placed into stock.
1. Purchase Order Report Template
A purchase order report template is more than a simple form you complete when stock hits its reorder point. It records every order the clinic places: what was requested, who approved it, what it cost, and when it’s expected to arrive. As the first control point in the supply chain, the PO report sets the baseline for what should show up before any stock is received.
Core Data Fields
Every PO report for an aesthetic clinic should include a unique PO number, issue date (MM/DD/YYYY), vendor name and contact, and a clear ship-to location. It should also list each item ordered, including:
- Product name
- Internal SKU
- Unit of measure
- Quantity ordered
- Unit cost
- Line total
The financial side should cover subtotal, tax, shipping, and the total PO amount. To complete the approval trail, include the approver’s name, role, and sign-off date.
Supply Chain KPIs Tracked
PO data helps track a few key supply chain metrics, including average supplier lead time, purchase price variance, order fill rate, and backorders.
Operational Use Case
When stock reaches the reorder point, the inventory coordinator creates a PO. Higher-value orders go through approval before they’re sent out. When the shipment arrives, staff compare what was delivered against the open PO and flag any differences right away.
That keeps approvals, ordering, and receiving tied together in one record instead of scattered across emails or spreadsheets.
Automation and Analytics Potential
When PO data connects with scheduling and usage records, the report starts doing more than tracking orders. It can help forecast demand. If projected procedure volume is climbing, the system can suggest a reorder before stock gets tight.
Platforms like Prospyr connect practice analytics with business operations, so clinic managers can see financial and supply activity in real time from one place. That means less back-and-forth between spreadsheets and appointment calendars.
Once the PO is approved, the receiving log verifies what actually arrived.
2. Receiving Log Template
The receiving log is what happens after the PO. It shows what showed up, what shape it was in, and whether it matched the order. In plain terms, it’s the checkpoint between purchasing and inventory control. That matters because it helps catch mistakes before products get stocked.
Core Data Fields
A receiving log for an aesthetic clinic should include the supplier name, PO number, received date and time, item name and SKU, quantity ordered, quantity received, unit cost, lot number, expiration date, arrival condition, storage conditions, and receiver initials. It should also include a notes field for discrepancies, substitutions, or damaged items.
For temperature-sensitive products, add a "Cold Chain Intact: Yes/No" checkbox and a temperature-reading field to confirm proper handling at arrival. If one shipment includes multiple lots of the same item, record one line per lot number so traceability stays in place.
Supply Chain KPIs Tracked
Receiving accuracy is the clearest metric here: correctly received items ÷ total items ordered × 100. If 47 of 50 units arrive, receiving accuracy is 94%. Other useful metrics include damage rate, short-shipment rate, on-time delivery rate, and discrepancy rate. Those same exceptions should also feed backorder and vendor reporting.
Operational Use Case
Complete the log when the shipment is received, before stocking or moving items into treatment rooms. Cross-check the physical delivery against the PO and packing slip with a three-way match. Then mark the receipt as full, partial, damaged, substituted, or pending vendor resolution. Any unmatched items should move straight into backorder tracking.
Automation and Analytics Potential
A digital receiving log can auto-populate PO data, use barcode scanning to cut manual entry, and trigger alerts when items arrive with expired dates or missing lot numbers. In Prospyr, digital receiving logs can auto-fill PO data, update inventory in real time, and keep receipt records tied to daily operations.
3. Backorder Tracking Report Template
If the receiving log tells you what showed up, the backorder tracking report tells you what didn't. It also makes clear who owns the next step. Any item that isn't fully received should go into this report right away.
Core Data Fields
A good backorder tracking template should include the item name, SKU or internal item code, product category, and priority level. It should also list the vendor name, purchase order number, quantity ordered, quantity on backorder, and quantity on hand.
For timing, include the date ordered, promised ship date, updated expected delivery date, and days outstanding. Status labels should stay simple and consistent: ordered, vendor confirmed, partially shipped, backordered, expected, received, substituted, canceled, and escalated. That way, everyone reads the report the same way instead of making guesses.
This report should also show the affected treatment and the number of scheduled appointments at risk. That's the part that turns a supply issue into an operations issue fast.
Supply Chain KPIs Tracked
The most useful metrics in this report are:
- Backorder rate
- Average days on backorder
- Fill rate
- Value of delayed stock
- Number of appointments affected by each stockout
These numbers help the team see more than "item missing." They show how much the delay is costing and where patient schedules may get hit.
Operational Use Case
Review this report daily or at least several times per week. Each open backorder should have a named staff owner and a follow-up due date. If an item is still unresolved, log the escalation date, vendor contact, vendor's response, and any approved backup plan.
That kind of tracking matters because backorders can drag on if no one is clearly responsible. A report like this keeps the ball from getting dropped.
Automation and Analytics Potential
Low-stock alerts and automatic status updates from vendor portals can cut down the manual follow-up tied to open items. When backorder data connects with scheduling and practice analytics in a platform like Prospyr, staff can respond to supply gaps without jumping between systems.
Those same updates should also feed vendor scorecards and reorder decisions.
4. Vendor Scorecard Template
The backorder report tells you what failed. The vendor scorecard helps you see why it keeps happening.
It pulls supplier data from purchase orders, receiving logs, backorder reports, and stock movement records into one running record for each vendor. That way, you’re not judging a supplier based on one bad shipment or a vague feeling that “they’ve been off lately.” You’re looking at the pattern.
Core Data Fields
Start with the basics: vendor name and ID, primary contact, account manager, product categories supplied, payment terms, and contract dates.
Product categories might include:
- Injectables
- Retail skincare
- Devices
After that, track the metrics that show how the vendor performs day to day: on-time delivery, fill rate, order accuracy, average lead time, and backorder rate.
You should also include financial fields like annual spend in USD and revenue impact from shortages. If a late shipment of injectables leads to missed appointments, that cost shouldn’t stay hidden.
For compliance, log lot numbers, expiration dates, and required regulatory documents. This matters even more for neurotoxins, dermal fillers, and temperature-sensitive items, where recordkeeping can’t be sloppy.
Supply Chain KPIs Tracked
A weighted scoring model works well for this report. It lets you assign points across areas such as delivery reliability, product quality and compliance, cost and terms, and responsiveness.
That setup makes side-by-side vendor comparison much easier. Instead of going with gut instinct, you have a clear scoring system that shows who’s doing the job well and who’s creating friction.
Operational Use Case
This report should usually be owned by the practice manager or supply chain lead, with input from clinical and front-desk staff. They often spot vendor issues first because they deal with late orders, missing items, and patient rescheduling in real time.
For most aesthetic clinics, a monthly or quarterly update cadence makes sense. The data can be pulled straight from the other four supply chain reports, which keeps the scorecard tied to actual operations instead of guesswork.
Its biggest use comes during contract renewals and vendor review meetings. With the scorecard in hand, the clinic can use hard numbers to renegotiate pricing, push for service fixes, or move more volume to suppliers that perform better. The same data can also help explain repeat shortages and overstock trends.
Automation and Analytics Potential
Automation can keep the scorecard current by pulling fill rates, lead times, discrepancy counts, and compliance data straight from receiving logs and purchase orders. That cuts down on manual work and lowers the odds of stale data.
When vendor performance data connects with scheduling and practice analytics, the scorecard becomes more than a reporting sheet. In a platform like Prospyr, the clinic can tie supplier delays to booked procedures, cancellations, and monthly revenue. That makes the report much more useful when deciding which vendors deserve more business.
Those same vendor trends should also show up in stock movement, which the next template tracks.
5. Stock Movement Report Template
Once items are purchased, received, placed on backorder, and checked against vendor records, the next step is simple: track what happens to that stock inside the clinic.
A stock movement report records every inflow and outflow after receipt. That includes receipts, transfers, usage, returns, adjustments, write-offs, and expirations.
Core Data Fields
Each transaction should include enough detail to tie it back to both a source and the person who recorded it. In practice, that means logging the movement date and time (MM/DD/YYYY, h:mm a), item identifier, product name and SKU, lot or serial number, expiration date, movement type, quantity moved, location, staff member, and a reference document such as a PO number or treatment ID.
Movement type can include:
- Receipt
- Transfer
- Issue to treatment
- Return
- Correction
- Adjustments for damage, loss, or expiration
Quantity moved should be recorded as positive for inflow and negative for outflow.
The report should also track beginning on-hand, receipts, transfers in and out, adjustments, ending on-hand, and unit of measure. Unit cost and extended value in USD should be logged too, so the practice can see the financial effect of usage, losses, and expirations.
Supply Chain KPIs Tracked
These movement records feed the control metrics that matter most:
| KPI | What It Measures |
|---|---|
| Inventory turnover | How efficiently products are used before expiration |
| Days on hand | How long current stock will last at average usage rates |
| Shrinkage rate | Losses from damage, theft, or undocumented usage |
| Expiration loss value | Total USD value of items written off due to expiration |
| Usage per procedure | Average product quantities used per treatment type |
Shrinkage should be reconciled against receiving and treatment records. If the numbers don’t match, that’s a signal to dig deeper.
Operational Use Case
This report works best when staff update it at the point of movement. Clinical staff should log usage right after each treatment, including vials opened, units used, and lot numbers. That keeps usage, billing, and inventory in sync.
The inventory manager should review high-dollar movements daily or weekly and compare them against appointment data. That makes it easier to spot issues like injectables used without a matching charge. On a monthly basis, leadership should review KPIs such as expiration loss and turnover, then use that data to adjust reorder points and clinic protocols.
Ownership should sit with the inventory manager. Clinical staff should be responsible for recording usage at the point of care. Billing and finance can then use the movement data to check that products consumed show up in revenue and cost of goods sold.
Automation and Analytics Potential
Barcode or QR scanning at the point of movement helps capture item, lot, and expiration data with fewer entry mistakes. When connected to scheduling and EMR/CRM tools, stock can decrement automatically when a treatment is documented. In plain terms, a completed appointment can deduct the preset unit count from inventory without a separate manual step.
Prospyr becomes most useful when the clinic wants inventory, scheduling, and revenue data in one workflow. It connects inventory to revenue and margins, which helps with forecasting, cost control, and reorder timing.
What to Include in Each Template
Once you’ve defined the five report types, the next move is to standardize the fields they share.
Standard Fields Used Across All 5 Reports
Every report should use the same core fields so you can trace and audit a single SKU across the full supply chain.
At a minimum, each template should include vendor name, item name and description, internal SKU or item code, quantity with a clear unit of measure like vials, syringes, or boxes, unit cost in USD, extended line cost, status, key dates such as order date, delivery date, or usage date, storage location, and accountability fields: Entered by, Received by, Reviewed/Approved by, and Verified by.
Use the same vendor name, SKU, and product description in every report. That one habit helps prevent mismatches and saves a lot of cleanup later.
When to Add Compliance and Traceability Fields
Not every product needs the same level of documentation. Low-risk consumables may only need basic quantity and cost fields. Items tied to regulation or patient safety need more detail, including lot, batch, expiration, and storage fields.
Lot, batch, and expiration data matter because they preserve traceability from receipt through use. For cold-chain products like botulinum toxin, receiving logs should also record the required temperature range in °F, the actual temperature at receipt, and a cross-reference to the temperature log. The CDC recommends keeping temperature logs for at least 3 years, so these records carry real compliance weight.
Here’s a simple rule of thumb:
- If a product affects patient safety or falls under regulatory oversight, include expiry and lot tracking.
- If it’s temperature-sensitive, add temperature monitoring fields and a link to the temperature log.
How to Assign Ownership and Set Update Frequency
Each report needs a named owner and a set update cadence. If no one owns it, records fall behind fast, and the data stops being trustworthy.
| Report | Primary Owner | Update Frequency |
|---|---|---|
| Purchase Order | Practice Manager / Purchasing Lead | Per order, real time |
| Receiving Log | Inventory Coordinator / MA | Same day as each delivery |
| Backorder Report | Inventory Manager | Weekly; daily for critical items |
| Vendor Scorecard | Practice Manager | Monthly or quarterly |
| Stock Movement | Clinical Staff + Inventory Manager | At point of movement; daily review |
Each template should also include Entered by and Reviewed/Approved by fields with timestamps. For high-risk items, add Verified by as well. That way, the templates hold up in day-to-day use instead of turning into paperwork nobody trusts.
Use these shared fields and ownership rules to compare the five templates side by side.
Comparison Table: The 5 Core Report Templates at a Glance
Use this table to compare the five templates by purpose, key fields, outputs, and cadence. Each one tracks a different handoff across the same supply chain.
| Template | Primary Purpose | Key Fields | Main KPI Outputs | Reporting Frequency |
|---|---|---|---|---|
| 1. Purchase Order Report | Formalize procurement and track committed spend | PO#, Vendor, SKU, Unit Cost, Total Cost, Expected Date | Open POs, total committed spend, PO cycle time, percent of orders received on time | Per order; monthly spend review |
| 2. Receiving Log | Verify delivery accuracy and condition | Date Received, PO#, Vendor, Item Name, Qty ordered/received, Lot/Batch, Expiry, Condition Notes, Receiver Initials | Order accuracy rate, discrepancy count, damage rate | Daily |
| 3. Backorder Tracking Report | Manage supply gaps and prevent treatment disruptions | Item Name, Vendor, Original PO#, Backordered Qty, Expected ETA, Fill Status, Substitute Options, Escalation Status | Number of backordered items, average days on backorder, stockout risk by category | Weekly |
| 4. Vendor Scorecard | Evaluate supplier performance over time | On-Time Delivery Rate, Fill Rate, Order Accuracy, Price consistency, Quality Issues, Response Time | Vendor reliability score, late delivery rate, contract price variance | Quarterly |
| 5. Stock Movement Report | Track how inventory changes through usage, waste, and adjustments | Opening Stock, Qty Received, Qty Used, Waste/expired, Closing Stock, Location, Reporting Period | Inventory turnover, usage rate, shrinkage %, expiration loss, days on hand | Weekly or monthly |
A few patterns jump off the page.
The Purchase Order Report, Receiving Log, and Stock Movement Report are the most operational. They follow the day-to-day movement of inventory, from placing an order to receiving it to seeing how stock changes over time.
The Backorder Tracking Report is more reactive by nature. It matters most when supply gaps start messing with scheduling and staff need a clear view of what’s delayed, what might run out, and what needs follow-up.
The Vendor Scorecard sits at the other end of the spectrum. It’s the most strategic of the five, helping teams decide which suppliers to keep, renegotiate with, or replace.
Here’s the simple flow: purchase orders approve spend, receiving checks what showed up, backorders point out gaps, vendor scorecards measure supplier performance, and stock movement shows what inventory actually did. These reports work even better when all of that data feeds into one shared analytics view. The next section shows how those data flows connect.
How Practice Analytics Connect the Full Supply Chain Picture
Once the templates are standardized, the next move is to connect the data inside them.
How the 5 Reports Feed One Another
The five reports work best as a single chain. PO data sets the order. Receiving confirms the shipment. Backorders flag exceptions. Vendor scorecards sum up patterns. Stock movement shows what’s happening to inventory in day-to-day use.
Each report feeds the next. That turns reporting from a set of separate documents into a steady supply process.
When the data is linked, clinics can use the same records to set reorder points and keep spend under control.
How Combined Data Supports Reordering and Cost Control
When you pull data from all five reports together, reordering becomes data-based instead of guesswork. Average weekly usage, vendor lead time, and safety stock help set reorder points. Backorder history adds another layer by showing which products come with more supply risk.
Cost control follows the same logic. When PO costs connect to stock movement, you can see cost per treatment by service line. If costs start climbing or waste starts showing up, you’ll spot it early - before margins start to slip.
Vendor scorecards help here too. They make pricing consistency and issue resolution measurable, instead of relying on someone noticing that an invoice looks off.
When an Integrated Platform Becomes Useful
As volume grows, med spa management software replaces separate spreadsheets that make it harder to keep the five reports in sync. The job gets even tougher when memberships create recurring demand patterns that shape supply planning.
At that point, tying supply chain reporting to one system starts to make sense. A platform like Prospyr brings scheduling, payments, memberships, EMR/CRM, and practice analytics into one HIPAA-compliant system.
When inventory data sits in the same place as your appointment calendar and payment records, you can connect backorders and stock usage to scheduled treatments, revenue, and recurring treatment patterns. That gives the reports more day-to-day use across operations and finance.
Conclusion
These five templates - Purchase Order Report, Receiving Log, Backorder Tracking Report, Vendor Scorecard, and Stock Movement Report - cover the supply chain from purchase to use. Used together, they help your clinic bring more control to purchasing and inventory use.
Start with the report tied to your biggest issue. If stockouts are costing your clinic revenue, begin with the Stock Movement Report. If shipments show up wrong or incomplete, begin with the Receiving Log. If one vendor keeps falling short, use the Vendor Scorecard first. One report used well is better than five reports left half-done.
After your team has the core templates in place, roll out the rest over 60–90 days. Then set aside 30 to 60 minutes each month to review the numbers, spot patterns, and adjust reorder points. That simple rhythm turns a set of templates into a working supply chain process.
The aim is steady progress, not perfection: fewer stockouts, fewer receiving issues, and vendor choices backed by numbers. Once those basics are in place, Prospyr can automate data capture and connect purchasing, receiving, usage, and analytics in one place.
FAQs
Which report should my clinic start with first?
Start by auditing your current processes to find bottlenecks and resource gaps.
Then bring your data into a HIPAA-compliant platform like Prospyr. Putting inventory tracking, supplier records, and performance analytics in one place cuts spreadsheet mistakes, gives you a clearer view of what’s happening in real time, and helps keep records organized and ready for inspection.
How often should each supply chain report be updated?
Update frequency should line up with supplier risk and how your practice runs day to day.
High-risk or critical suppliers should be reviewed quarterly or every six months. Medium-risk suppliers should be reassessed once a year, and low-risk partners every two years.
If there’s a major organizational change, update plans right away. For day-to-day tracking, use automated daily monitoring, mid-month reviews, and monthly tie-outs to keep data accurate and audit-ready.
What data fields are most important for recall tracking?
Key recall-tracking fields include the event date, the exact instruments or products that were processed or used, and their batch or lot numbers.
You should also record cycle parameters, staff identity, and any related indicator or test results. When these records live in one central, HIPAA-compliant system, it becomes much easier to pinpoint affected inventory or patient treatments fast.