
If I want to find growth leaks in a med spa fast, I track 12 numbers every month. The big ones are booking rate, lead cost, conversion, retention, utilization, and revenue per room. In this article, I show the formulas, common U.S. ranges, and what each KPI tells me about leads, patient return visits, provider time, and room use.
In plain terms, here’s what this article covers:
- Lead flow: booking rate, cost per lead, lead-to-patient conversion
- Patient value: lifetime value, retention rate, rebooking rate
- Capacity: provider utilization, treatment room utilization
- Revenue: revenue per treatment room, revenue per provider hour, average revenue per visit
- Recurring income: membership conversion rate
A few benchmark numbers stand out right away:
- Booking rate: 50%–70%
- Cost per lead: $30–$80
- Lead-to-patient conversion: 30%–40%
- Patient retention: 60%–80%
- Provider utilization: 70%–85%
- Treatment room utilization: 70%–85%
- Revenue per treatment room: $200,000–$500,000+ per year
- Membership conversion: 10%–35%+
The main point is simple: if I can measure where leads stop, where patients fail to return, and where schedule capacity sits idle, I can see what is holding revenue back without guessing.
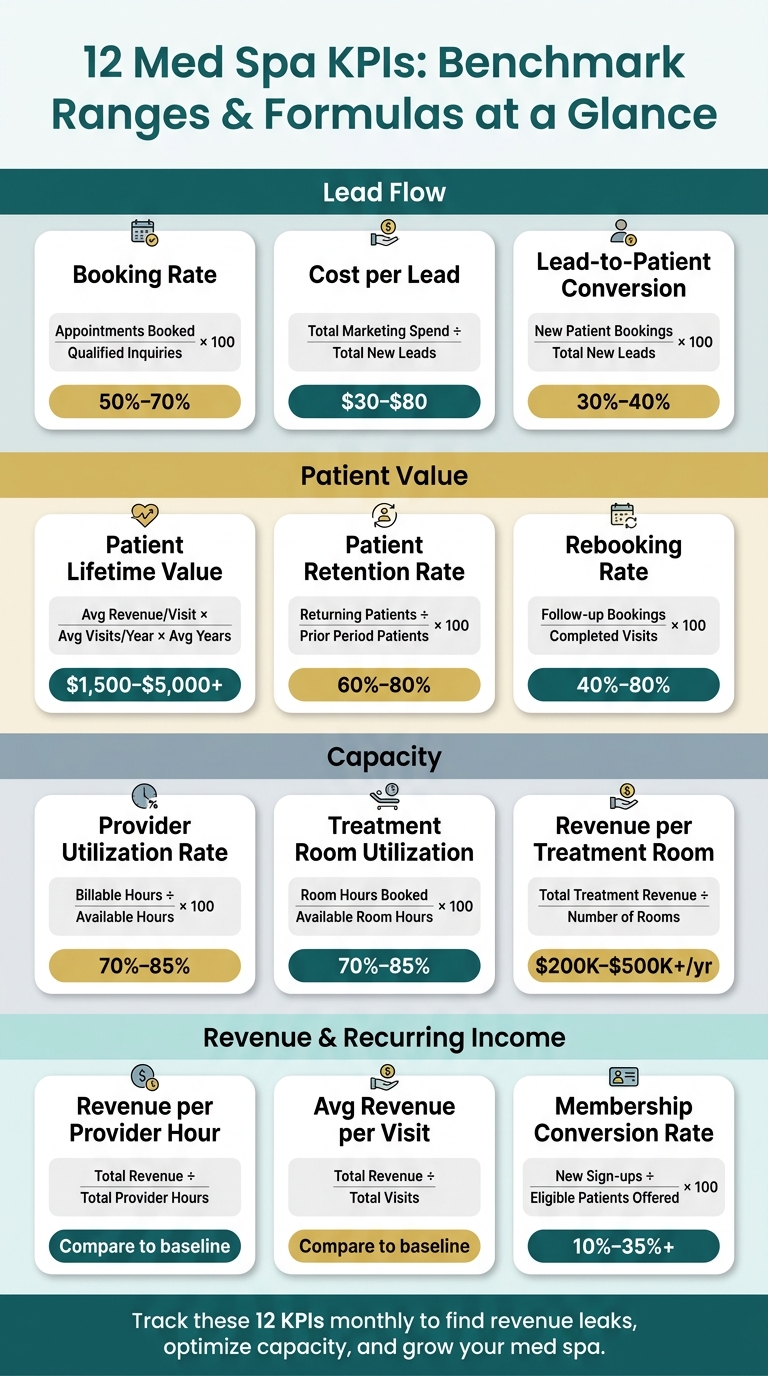
12 Med Spa KPIs: Benchmark Ranges & Formulas at a Glance
Quick Comparison
| KPI | What it measures | Common U.S. range |
|---|---|---|
| Booking Rate | Qualified inquiries that become appointments | 50%–70% |
| Cost per Lead | Marketing cost for each new lead | $30–$80 |
| Lead-to-Patient Conversion | New leads that become new patient bookings | 30%–40% |
| Patient Lifetime Value | Revenue from a patient over time | $1,500–$5,000+ |
| Patient Retention Rate | Patients who return in 6–12 months | 60%–80% |
| Rebooking Rate | Visits that turn into a follow-up booking | 40%–80% by patient type |
| Provider Utilization Rate | Provider time used for billable care | 70%–85% |
| Treatment Room Utilization | Room time used for booked treatments | 70%–85% |
| Revenue per Treatment Room | Treatment revenue by room | $200,000–$500,000+ yearly |
| Revenue per Provider Hour | Revenue for each provider hour worked | Compare to internal baseline |
| Average Revenue per Visit | Revenue from each completed visit | Compare to internal baseline |
| Membership Conversion Rate | Eligible patients who join a membership | 10%–35%+ |
Bottom line: this is a KPI checklist for seeing where money is lost, where systems break down, and what to fix first.
sbb-itb-02f5876
How to Use This KPI List
Each KPI entry below uses the same format: a plain-English definition, a formula you can calculate by hand, a benchmark range for U.S. med spas, and a short note on why it matters.
The benchmark ranges give you a practical way to judge performance.
Track each KPI every month so you can spot patterns early. For metrics that move more slowly, use annual data instead. Start with the KPIs linked to your biggest revenue gap, then build a monthly baseline for the rest. Once you know where to focus, compare each formula with its benchmark range.
1. Booking Rate
What it is: Booking rate is the share of qualified inquiries that turn into confirmed appointments. That means you leave out spam, vendors, job seekers, and contacts who aren't a fit or are outside your service area.
Formula: Booking Rate = (Appointments booked ÷ Qualified inquiries) × 100
Higher is better.
Here’s a simple example: if you get 200 qualified inquiries in a month and 110 of them become scheduled appointments, your booking rate is 55%.
For U.S. med spas, a 50%–70% booking rate is common. Leads from phone calls and referrals tend to book at a higher rate than paid social leads.
Why it matters: Booking rate shows how well your team turns interest into scheduled revenue. It's a metric with a lot of upside. Even a small bump can bring in more appointments without spending more on ads.
Once you know how many leads book, the next step is to measure what those leads cost.
2. Cost per Lead
What it is: After booking rate, the next thing to check is what each lead costs you. Cost per lead, or CPL, shows how much you're spending on marketing to generate one inbound inquiry. This is a critical metric to monitor when opening a med spa to ensure your initial marketing budget is used efficiently. For med spas, that usually means the cost to generate a single inbound phone call.
Formula: Cost per Lead = Total Marketing Spend ÷ Total Number of New Leads (Inbound Calls)
For U.S. med spas, CPL often lands between $30 and $80.
Why it matters: CPL helps you see where your budget is doing its job and where money may be slipping away. But a low CPL, by itself, doesn't mean much. If those leads aren't qualified or aren't a fit for your services, cheap leads can still be expensive in the long run.
To measure acquisition cost the right way, separate first-time callers from existing patients.
Then compare CPL with conversion rate to see if your marketing spend is bringing in actual patients or just more inquiries.
3. Lead-to-Patient Conversion Rate
What it is: Booking rate tells you who schedules. Lead-to-patient conversion rate goes one step further. It shows how many new leads turn into booked patients.
Formula: Lead-to-Patient Conversion Rate = (New patient appointments booked ÷ Total new leads) × 100
For med spas, a solid benchmark is 30% to 40%. Top-performing practices hit 52.36% in 2024/2025. That range helps you spot where the issue may be. If your rate is low, the problem often comes down to lead quality or how fast your team follows up.
Why it matters: A low conversion rate, even with steady lead volume, is often a sign that something is off with lead quality or front-desk follow-up. Some leads look good on paper but never had a real chance of becoming patients. Think billing questions or fraudulent ad clicks. They still count as leads, which can make volume look higher than it is without adding actual revenue opportunity.
New leads also tend to convert at a lower rate than existing patients. That’s why speed matters so much here. If calls go unanswered or follow-up drags, those leads can disappear fast. In many practices, missed calls and slow response time are two of the biggest reasons conversions slip.
4. Patient Lifetime Value
What it is: Patient lifetime value (LTV) is the total revenue a patient brings in over the course of their relationship with your practice.
Formula: Patient LTV = Average Revenue per Visit × Average Number of Visits per Year × Average Patient Lifespan (in years)
For U.S. med spas, LTV usually falls between $1,500 and $5,000+, depending on your service mix, membership offers, and how well you keep patients coming back.
Why it matters: LTV tells you whether your booking and conversion efforts lead to long-term revenue. If LTV is high, that usually means patients return and keep spending over time. If it's low, there's likely a problem with retention, acquisition quality, or both.
Because LTV depends on repeat visits, the next KPI is patient retention rate.
5. Patient Retention Rate
What it is: Patient retention rate measures the share of existing patients who come back at least once within 6 to 12 months. Put simply, it shows whether a first visit turns into repeat revenue.
Formula: Patient Retention Rate (%) = (Returning patients ÷ Patients in the prior period) × 100
If 280 of 400 patients returned, your retention rate is 70%.
Common U.S. med spa benchmarks:
| Performance Level | Retention Rate | What It Signals |
|---|---|---|
| Poor | Below 60% | Serious gaps in experience or follow-up |
| Average | 60–70% | Most patients are coming back, but follow-up can be better |
| Excellent | 70–80%+ | Top-tier performance; strong loyalty and recurring revenue |
Why it matters: Retention takes pressure off patient acquisition and makes revenue easier to forecast. When retention falls below 60%, the problem usually isn't marketing by itself. More often, it's tied to the patient experience, post-visit engagement, or weak follow-up.
A rolling 12-month retention rate gives you the clearest read on the health of the business. If you want an early signal for new-patient onboarding, track the 6-month return rate too.
Low retention often shows up first as weak rebooking, which is the next KPI to watch.
6. Rebooking Rate
What it is: Rebooking rate measures the share of completed visits that turn into a future appointment, either before checkout or soon after.
Formula: Rebooking Rate (%) = (Patients who booked a follow-up visit within X days ÷ Total completed visits) × 100
Here’s a simple example: if 80 out of 200 completed visits in a month led to a follow-up appointment booked within 14 days, your rebooking rate is 40%. Stick with one time window, such as 7 or 14 days, so your numbers stay consistent over time.
Use these ranges to spot weak checkout performance with med spa analytics by patient type:
| Patient Type | Warning | Healthy | Top Performer |
|---|---|---|---|
| Existing clients | 40–59% | 60%+ | 70–80% |
| New clients (first 6 months) | 30–39% | 40%+ | N/A |
Why it matters: If retention tells you who came back, rebooking tells you who already plans to come back. That’s the key difference. Retention rate reflects return behavior over time. Rebooking rate is a leading indicator, which means it shows you, right now, whether patients are leaving with the next visit already on the calendar.
This metric tends to be stronger for services with repeat maintenance cycles, like injectables, laser series, peels, and memberships. In those cases, booking the next visit is usually straightforward. So when rebooking is low, the issue often isn’t demand. More often, it points to a missed prompt at checkout or weak follow-up after the visit.
7. Provider Utilization Rate
After rebooking, the next thing to check is capacity. Put simply: can your schedule handle the demand you’re bringing in?
What it is: Provider utilization rate measures how much of a provider’s available clinical time is spent on billable patient care.
Formula: Provider Utilization Rate (%) = (Billable Clinical Hours ÷ Available Clinical Hours) × 100
If an injector has 160 available hours in a month and completes 120 billable hours, the utilization rate is 75%.
For U.S. med spas, 70%–85% is a healthy range. Below 60% points to underuse. Above 85%–90% points to capacity strain.
Use this table to spot underfilled schedules and stretched providers at a glance.
| Utilization Level | Range | What It Signals |
|---|---|---|
| Under-utilized | Below 60% | Too many open slots; idle payroll costs |
| Healthy | 70%–85% | Strong revenue with a sustainable workload |
| Overutilized | Above 85%–90% | Burnout risk; limited room for new patients |
Why it matters: Low utilization means you’re paying for time that isn’t being used. High utilization means the schedule may be too tight. And that has direct planning value.
Say Friday afternoons keep coming in low. That may point to a scheduling change, or a targeted promotion to fill those open slots. On the other hand, if utilization stays high across the board, it may be time to bring on another injector or aesthetician.
This KPI helps you see what’s holding growth back: not enough demand, or not enough provider capacity. Track it by day and by provider so you can adjust hours, fill weak spots in the schedule, or add capacity before the team gets overloaded.
8. Treatment Room Utilization
After provider utilization, look at whether your rooms are pulling their weight.
What it is: Treatment room utilization measures the share of available treatment room time used for billable appointments. A provider can have a packed schedule while a room still sits empty. The reverse can happen too: rooms stay busy, but provider time is assigned poorly. That’s why this metric needs its own check.
Formula: Treatment Room Utilization (%) = (Total Treatment Room Hours Booked ÷ Total Available Treatment Room Hours) × 100
Use scheduled hours minus closures and maintenance.
Here’s a simple example: if a room is open 40 hours per week and 28 of those hours are booked for treatments, that room is running at a 70% utilization rate.
For many U.S. med spas, 70%–85% is a practical target. Below 55% points to underuse. Above 85% usually means strain.
| Utilization Level | Range | What It Signals |
|---|---|---|
| Underperforming | Below 55% | Fixed costs not being covered by revenue |
| Healthy | 70%–85% | Efficient use of space with room to grow |
| Overutilized | Above 85% | Bottlenecks and sustained capacity strain |
Why it matters: Treatment rooms are fixed-cost assets. Rent, utilities, and equipment costs don’t stop just because a room is empty. When utilization is low, those room costs aren’t being supported by revenue.
This metric gets more useful when you track it by room instead of only looking at the business as a whole. That’s where patterns start to show up. One weak room may point to uneven demand, gaps in the schedule, or a service mix that doesn’t fit how the space is being used. On the other hand, if room utilization stays high for a long stretch, that’s often a sign you need more operating hours or more treatment space.
Prospyr can automate room-level tracking through scheduling and practice analytics.
Once room use is clear, the next KPI shows how much revenue each room produces.
9. Revenue per Treatment Room
What it is: Revenue per treatment room shows how much money each room brings in during a set time period. Use treatment revenue only here. Leave out retail sales.
Formula: Revenue per Treatment Room = Total Treatment Revenue for the Period ÷ Number of Treatment Rooms
Here’s a simple example. If your med spa earns $180,000 in treatment revenue over one quarter and you have 3 treatment rooms, each room brings in $60,000 per quarter. That works out to $20,000 per month per room.
For U.S. med spas, a common target is $300,000 to $450,000 per room per year. The broader benchmark range is $200,000 to $500,000, and $500,000+ points to strong performance.
| Performance Level | Annual Revenue per Room | What It Suggests |
|---|---|---|
| Early-stage | Below $200,000 | Check utilization, pricing, and service mix before expanding |
| Healthy | $200,000–$500,000 | Efficient use of existing capacity |
| High-performing | $500,000+ | Strong demand; expansion may make sense |
Why it matters: This KPI helps you see whether you should get more out of the rooms you already have before adding more space. If revenue per room is low, look at utilization, pricing, and your service mix first. Then check provider output next.
Next: revenue per provider hour.
10. Revenue per Provider Hour
What it is: Revenue per provider hour shows how much revenue each provider brings in for every hour worked. It tracks how well provider time turns into revenue.
Formula: Revenue per Provider Hour = Total Revenue Generated ÷ Total Provider Hours
After room-level revenue, this is the next place to look. It helps you measure output at the provider-hour level instead of only looking at room use.
Why it matters: This metric helps you spot why performance is soft. Is the issue weak booking? Lower-priced services? The wrong schedule mix? That's where revenue per provider hour becomes useful.
If this number is low, even when utilization is strong, the problem often sits with pricing, service mix, or case mix. In plain terms, providers may be staying busy without bringing in enough revenue for the time they spend working.
Next, compare it with average revenue per visit to see whether the bigger limit is volume or ticket size.
11. Average Revenue per Visit
What it is: Average revenue per visit is the average $ amount earned from each completed appointment.
Formula: Average Revenue per Visit = Total Revenue ÷ Total Number of Visits
Higher is better.
U.S. benchmark: There’s no single U.S. number that fits every practice. The better move is to compare this KPI against your own monthly baseline and service mix. When this number goes up, it often points to stronger pricing, a better mix of services, or better upsell results.
Why it matters: This metric shows the ticket size behind each visit. It’s one side of revenue per provider hour, and it helps answer a simple question: are your patient visits turning into solid revenue?
A packed schedule can look great on paper and still underperform. If too many appointments are tied to lower-priced services, revenue may lag even when visit volume stays high. That’s where this KPI helps. It separates visit count from visit value.
If one treatment brings in lots of traffic but keeps your average revenue per visit low, that can be a sign to push higher-value services more often.
12. Membership Conversion Rate
If your med spa offers memberships, this is one number worth watching closely: how many eligible patients actually sign up.
What it is: Membership conversion rate is the share of eligible patients who join a membership during a month or quarter.
Formula: Membership Conversion Rate (%) = (Number of new membership sign-ups ÷ Number of eligible patients offered a membership in the period) × 100
Higher is better.
U.S. benchmark: Most U.S. med spas fall somewhere in this range:
| Conversion Rate | What It Signals |
|---|---|
| Under 10% | The offer may need refinement, or membership may not be presented consistently |
| 10–20% | Developing; common for newer programs |
| 20–35% | Strong; usually reflects a clear offer and trained staff |
| 35%+ | High; membership is part of the standard patient flow |
Why it matters: A higher membership conversion rate supports more predictable, recurring revenue. That can lift LTV, retention, and average visit value.
The sign-up process matters more than many teams expect. Long or confusing enrollment forms can cut conversion by 30%–50%. If joining feels like paperwork overload, people often stall or drop off.
A smoother process can help. Digital forms, integrated payments, and clear terms reduce friction at sign-up and make the offer easier to say yes to. Platforms like Prospyr can automate enrollment, billing, reminders, and record tracking.
Next, use the quick reference table to compare all 12 KPIs side by side.
KPI Quick Reference Table
Use this table as a quick scan of the formulas and benchmark ranges above. It helps you compare the metrics that have the biggest impact on med spa growth, capacity, and retention.
Prospyr can pull these KPIs into one dashboard.
| KPI | Formula | Typical U.S. Benchmark | Why It Matters |
|---|---|---|---|
| Booking Rate | (Appointments booked ÷ Qualified inquiries) × 100 | 50–70% | Shows how well your team turns interest into appointments |
| Cost per Lead | Total marketing spend ÷ Total new leads (inbound calls) | About $30–$80 per inbound lead | Tracks how efficiently your budget generates potential patients |
| Lead-to-Patient Conversion Rate | (New patient appointments booked ÷ Total new leads) × 100 | 25–40%; above 40% is strong | Reveals how well your consult and follow-up process converts leads |
| Patient Lifetime Value (LTV) | Average revenue per visit × Average visits per year × Average years as a patient | About $1,500–$5,000+ per patient | Shows how much long-term revenue each patient relationship generates |
| Patient Retention Rate | (Returning patients ÷ Patients in the prior period) × 100 | 60–80% over 12 months | Indicates whether your experience and follow-up keep patients coming back |
| Rebooking Rate | (Patients who booked a follow-up visit within X days ÷ Total completed visits) × 100 | 60–80%; top performers: 70–80%+ | Predicts near-term revenue and smooths your schedule |
| Provider Utilization Rate | (Billable provider hours ÷ Total available provider hours) × 100 | 70–85%; above 90% risks burnout | Shows whether provider schedules are over- or under-booked |
| Treatment Room Utilization | (Hours rooms were occupied ÷ Total available room hours) × 100 | 70–85%; below 55% signals underuse | Shows when to add or reduce room capacity |
| Revenue per Treatment Room | Total revenue for the period ÷ Number of treatment rooms | About $200,000–$500,000+ per room annually | Measures how much each room generates so you can improve ROI |
| Revenue per Provider Hour | Total treatment revenue ÷ Total billable provider hours | Directional; compare by role | Indicates clinical productivity and pricing effectiveness |
| Average Revenue per Visit | Total treatment revenue ÷ Total number of visits | Directional; compare against your monthly baseline | Shows visit value and highlights where upsells could improve performance |
| Membership Conversion Rate | (New membership sign-ups ÷ Eligible patients offered a membership) × 100 | 10–35%+; higher for established programs | Shows how well you're converting patients into recurring revenue |
Use this table to find the weakest KPI first, then move to the action steps below.
How to Turn KPI Data into Action
Once you spot the weakest KPI, don’t stop at the top-line number. Break it into segments so you can see what’s causing the shortfall. Look at provider, treatment, room, channel, membership, and time of day to find revenue leaks. The idea is simple: start with the KPI that missed the benchmark, then trace the loss back to its source.
This works well for diagnosing a weak booking rate, CPL, retention, or utilization. Instead of guessing, you’re narrowing the problem down piece by piece.
Segmenting by marketing campaign and lead source helps you separate channels that drive inquiries from channels that drive actual revenue. That matters because some channels may send plenty of calls but produce no revenue.
Time of day is another useful filter. Review missed calls by hour. Lunch and after-hours often have the highest miss rates, and any rate above 10% points to a staffing or routing issue that needs attention.
It also helps to split new and existing patient data. New patients usually convert at 40% to 60%, while existing patients convert at 70% or more. Put new patient calls first in the queue, and you may lift overall booking rates by 15% to 20%.
When all of this data lives in different tools, the review can turn into a slog. Centralizing it makes the process much faster. Prospyr brings scheduling, lead capture, email/SMS, memberships, and analytics into one HIPAA-compliant system.
Conclusion
Profit starts with tracking the right KPIs on a steady basis. These 12 KPIs turn day-to-day activity into a clear monthly scorecard.
Aim for a 50%–70% booking rate, 70%–85% provider utilization, and $200,000–$500,000+ in annual revenue per treatment room. Use the benchmark table as your first pass, then dig into the weak spots. If a KPI falls short of the benchmark, use the formula to find the break point.
You can start with a spreadsheet. As volume grows, pull scheduling, payment, and marketing data into one place. When those numbers sit in separate tools, centralizing them cuts review time. Prospyr keeps reporting in one place. Review these 12 metrics for 90 days to build a baseline and spot the biggest leaks. Then review the metrics each month, act on the weakest one, and reset the baseline each quarter.
FAQs
Which KPIs should I track first?
Start with marketing ROI. Then track missed-call rate and the conversion steps tied to it so you can spot leads that slip through the cracks.
At the same time, watch your lead-source KPIs:
- Cost per lead
- Cost per consult
- Booking rate
- No-show rate
- Close rate
- Patient value and payback period
Taken together, these numbers show which channels bring in booked patients and long-term revenue.
How often should I review med spa KPIs?
It depends on the metric.
- Weekly: scheduling templates, accounts receivable, and active marketing or patient reactivation campaigns
- Monthly: lead source data, scheduling performance, booking metrics, and clinical quality assurance
- Quarterly: patient retention rates
- Annually: compliance and credentialing reviews
This kind of review rhythm helps you catch patterns early, fix problems before they grow, and keep an eye on long-term trends.
What should I do if a KPI is below benchmark?
If a KPI falls below benchmark, don't try to fix everything at once. Start with a root-cause analysis and figure out where the bottleneck is. It could be one provider, one service type, or even a certain time of day.
Then test one change at a time for 30 days and compare the results with the previous period. That way, you can see what actually moved the needle.
For example, if booking rate is low, look for slow follow-up or front-desk friction before blaming the lead source. A monthly data audit also helps you spot patterns early, before a small issue turns into a bigger one.