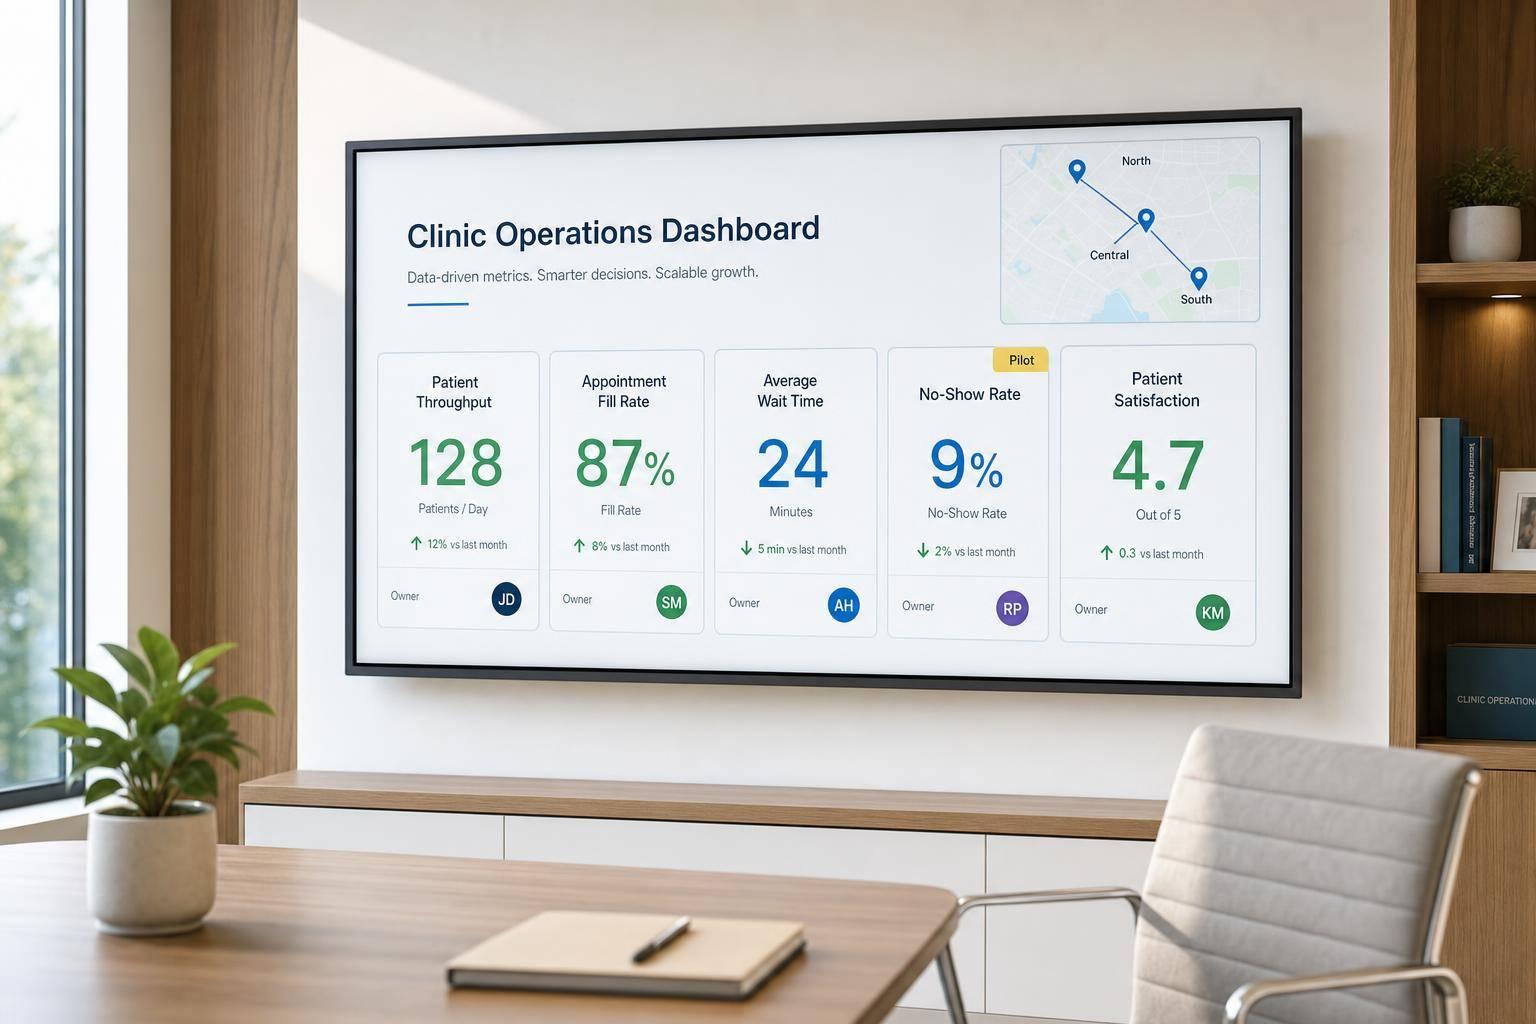

If you want to grow a clinic without losing margin, you need a small set of numbers you check every month. The article’s core point is simple: track the same KPIs across every provider and location, give each number a clear owner, and use those numbers to fix problems before you add staff, rooms, or sites.
Here’s the short version:
- Watch leading and lagging KPIs together.
- Leading: rebooking rate, schedule gap rate, provider utilization
- Lagging: revenue, EBITDA, retention, margin
- Use shared definitions across locations.
- If each site measures things differently, comparisons are useless.
- Focus on three metric groups.
- Revenue and margin
- Patient acquisition and retention
- Scheduling and staff performance
- Build one data view across EMR, payments, and marketing.
- Without connected data, owners often cannot answer simple profit questions.
- Assign each KPI to one person.
- Providers, front desk, marketing, managers, and owners should each own specific numbers.
- Test changes before you expand.
- Review results for 3 to 6 months before opening another room, hiring, or adding a location.
A few numbers from the article stand out:
- Rebooking rate: 60%+ is a solid target
- Provider utilization: 75%–85% is a good range
- Payroll over 50% of revenue is a warning sign
- Schedule gap rate under 10% is the goal
- A KPI system can improve EBITDA by 8% to 20% within the first year
If I were boiling the whole article down to one line, it would be this: don’t scale based on gut feel; scale when your numbers stay steady and your team knows who owns each one.
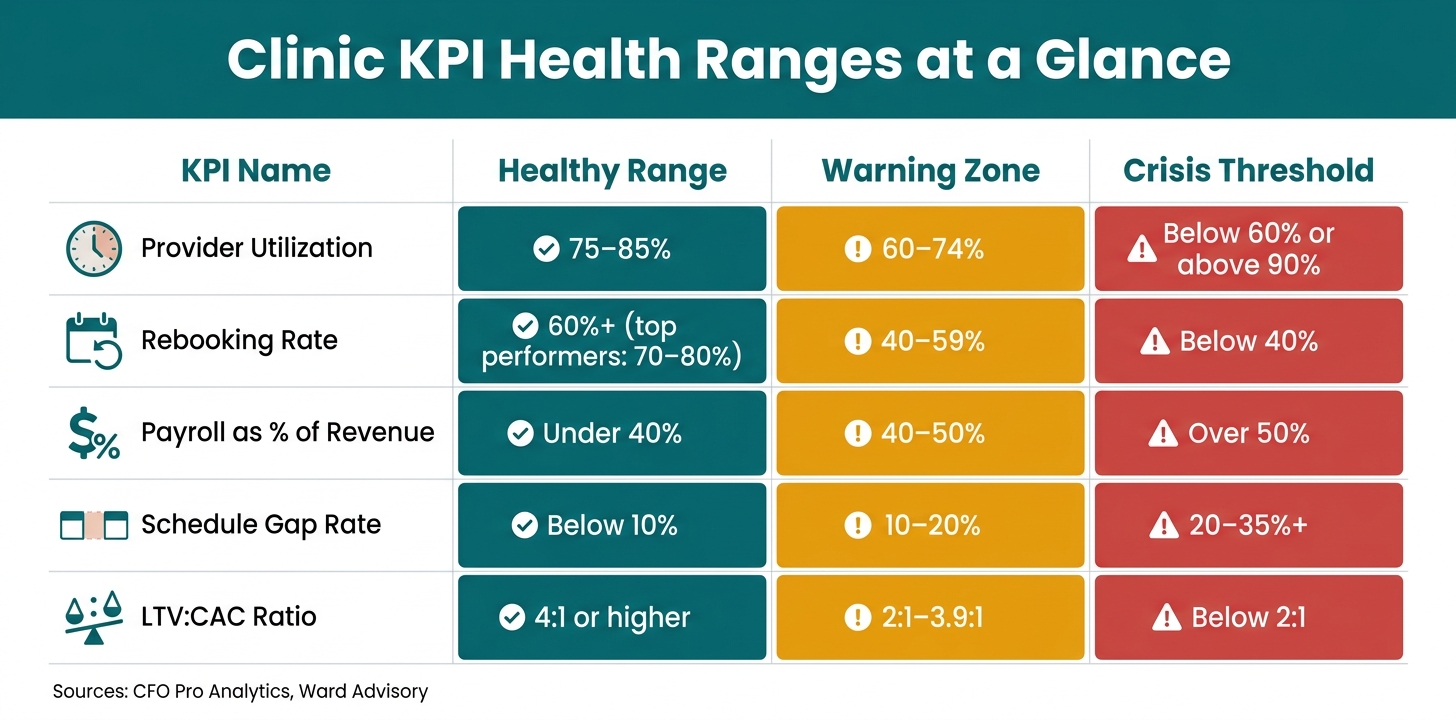
Clinic KPI Health Ranges: Healthy vs. Warning vs. Crisis Thresholds
1. The Core Principles Behind Metric-Led Clinic Growth
Before you scale your med spa, get clear on which numbers actually predict performance. Not every metric matters the same way. And if you track the wrong ones - or track the right ones in different ways across locations - you can end up with a false read on how the business is doing.
Leading vs. Lagging Indicators for Clinic Decisions
Use two types of metrics: lagging indicators show results, while leading indicators point to what may happen next. Lagging indicators tell you what already happened, like monthly revenue, EBITDA, and patient retention rates. They help you read past performance. But when they show a problem, you're often already paying for it.
Leading indicators give you an earlier signal. Think rebooking rates, provider utilization, and schedule gap rates. These numbers give clinic leaders time to step in before a small issue turns into an expensive one.
For example, a schedule gap rate in the 20%–35% range is common in the industry, while best-in-class clinics keep it below 10%. And if rebooking drops below 40%, that's a serious sign that retention is slipping.
Once you know which metrics flag trouble early, the next move is simple: define them the same way at every site.
Standardized KPI Definitions
A metric only helps if everyone measures it the same way. If one location uses one formula and another uses something else, the comparison falls apart.
Each KPI needs a clear formula that the whole group uses. Define provider utilization as booked clinical hours divided by available clinical hours, with a target of 75%–85%. Below 60% usually points to staffing inefficiency. Above 90% can signal provider strain, which may hurt care quality and make scheduling harder.
Revenue per clinical hour also matters, and it should be tracked by provider role. That way, you're comparing like with like. Benchmarks range from about $350–$650 per hour for RNs to $600–$1,200 per hour for NP/PA injectors.
With shared definitions in place, you can build a KPI set that tracks more than top-line growth.
Balance Growth, Experience, and Safety
It's easy to chase revenue. What's harder is growing without wearing down the patient experience or pushing providers too far. That's why a smart KPI set needs to track both business output and operating health.
A three-location medspa with $9.2 million in revenue showed what that balance can look like. Over nine months, they lifted provider utilization from 52% to 78%, improved rebooking from 42% to 71%, and reduced their service menu from 61 offerings to 28. The result: EBITDA margin doubled from 11% to 22% - without adding new equipment, rooms, or providers.
The table below shows how core metrics move from healthy to warning to crisis:
| KPI | Healthy Range | Warning Zone | Crisis Threshold |
|---|---|---|---|
| Provider Utilization | 75–85% | 60–74% | Below 60% or above 90% |
| Rebooking Rate | 60%+ | 40–59% | Below 40% |
| Payroll as % of Revenue | Under 40% | 40–50% | Over 50% |
| Schedule Gap Rate | Below 10% | 10–20% | 20–35%+ |
| LTV:CAC Ratio | 4:1 or higher | 2:1–3.9:1 | Below 2:1 |
Sources: CFO Pro Analytics, Ward Advisory
Use these ranges to spot the biggest gaps first. They set the baseline for deciding which KPIs deserve the most attention in the next section.
sbb-itb-02f5876
2. The Key Metric Categories Clinics Should Track
Once your KPI definitions are in place, sort your metrics into three buckets: revenue, patient, and operations. That keeps things clean. If you track too many numbers, you end up with noise instead of insight.
A tighter set of metrics across these three areas gives you a much clearer view of scale. It also helps you spot where growth is coming from: stronger demand, better retention, or tighter day-to-day execution.
Revenue, Profitability, and Patient Value Metrics
Revenue by itself can be misleading. A top-line jump might look good, but it doesn't tell you if that growth is healthy. Start by breaking revenue out by service line and provider so you can see which parts of the clinic are driving the best results.
Then look at gross margin per service. The formula is simple: subtract COGS from revenue, then divide by revenue. For injectables and skincare, a healthy COGS target usually lands between 20% and 25%. Once it gets above 35%, that's a red flag. In many clinics, that points to product waste or treatment creep eating into margin.
LTV matters here too. It shows the total value of a patient over time, not just what they spent on a single visit. When you track LTV by segment, you can see which services, channels, and locations bring in patients who stick around and spend more over the long haul.
| Metric | Formula | Example |
|---|---|---|
| Revenue per Clinical Hour | Total Revenue ÷ Total Clinical Hours | $100,000 ÷ 200 hrs = $500/hr |
| Average Case Value | Total Revenue ÷ Total Cases | $50,000 ÷ 20 = $2,500 per case |
| Gross Margin % | ((Revenue − COGS) ÷ Revenue) × 100 | (($1,000 − $400) ÷ $1,000) × 100 = 60% |
| Patient LTV | Avg. Visit Value × Annual Visits × Years Retained | $500 × 3 × 5 = $7,500 |
| MRR (Memberships) | Active Members × Monthly Fee | 100 × $150 = $15,000 MRR |
After that, shift to how patients enter the clinic, come back, and stay active over time.
Acquisition, Retention, and Membership Metrics
This is where you find the leaks.
Track conversion from initial inquiry to consult, then from consult to treatment. That shows exactly where people drop off in the journey. For surgical procedures, high-performing aesthetic practices often post consultation-to-surgery conversion rates of 30% to 50%, depending on the procedure mix.
Rebooking rate is one of the earliest retention signals you can track. It measures the share of patients who book their next appointment before they leave, or within seven days. A healthy target is 60% or higher, while top-performing practices often land between 70% and 80%.
Keeping current patients matters because new-patient acquisition isn't cheap. Bringing in a new patient can cost 5 to 25 times more than keeping an existing one. That's why automated SMS or email follow-ups at 7, 14, and 30 days after a visit can pay off, especially for patients who didn't rebook at checkout.
For clinics with memberships, don't look at MRR alone. Track membership churn and unused benefits together. Low unused-benefit rates can point to margin leakage, while high unused-benefit rates can hint at churn risk. MRR helps smooth revenue between larger procedures, and a healthy membership breakage rate usually falls between 18% and 35%.
Operational, Experience, and Quality Metrics
Operational metrics tend to spot trouble early, before it hits revenue.
Provider utilization and revenue per clinical hour show whether paid labor is turning into revenue in an efficient way. A healthy utilization target is 75% to 85%. If you're below 60%, there's likely inefficiency in staffing or healthcare scheduling. If you're above 90%, that's often a sign of burnout risk or appointment bottlenecks.
No-show rate is another one to watch closely. Rates vary a lot, but strong clinics stay below 11.2%.
On the patient experience side, NPS and CSAT help round out the picture. They show how patients feel after they leave the clinic, not just what happened during the visit. In healthcare and aesthetics, average NPS sits around +58, while strong CSAT scores usually fall between 60 and 80.
These numbers only help if every location tracks them the same way.
3. Building a Data Infrastructure That Works Across Multiple Locations
Good metrics only work when every location sends the same data into one system. As you open more sites, that gets harder to manage, and the cost of mistakes climbs fast. 9 in 10 multi-location operators cannot answer basic profitability questions before unifying their data. That points to a systems issue, not a strategy issue. Once your KPI definitions are in place, the next choke point is the data layer behind them.
Create One Source of Truth for Scheduling, Clinical, Payment, and Marketing Data
The first job is to standardize what each site calls, counts, and reports. Most growing clinics end up with data spread across three core streams: EMR/clinical data such as appointments, services, provider utilization, treatment history, retention, and rebooking; financial data such as revenue by location, labor costs, cost of goods sold, and margin by service; and marketing/analytics data such as ad spend by channel, new patient acquisition, campaign performance, and source attribution.
When those streams stay separate, blind spots show up fast. Provider productivity gaps can slip by. Missed renewals can sit there unnoticed. And it gets hard to tell what's working and what's just making noise.
45% of the average practice's revenue has no attribution data at all before systems are unified. A unified reporting layer brings those streams into one view, so you can spot what's driving growth and what's quietly draining it.
Standardize Data Definitions, Coding, and Governance
Centralization falls apart without consistency. If one location labels the same treatment one way and another location uses a different name, revenue reports split into duplicate records. At that point, comparing locations stops being useful.
Before you scale, lock in a standardized service catalog - a shared list of service names and categories used the same way across every location. Apply the same approach to KPI definitions and provider roles. As CorralData notes:
"What matters less than which definition you use is that the same definition is applied consistently across all locations."
New locations should be segmented for their first 90 to 180 days. Their ramp-up numbers will almost always look weaker than those of mature sites, and if you mix them together, your portfolio benchmarks get skewed. It also helps to document reporting rules so clinical and finance teams use the same formulas and filters, not two separate versions of the truth.
How Prospyr Supports Metrics-Ready Clinic Operations
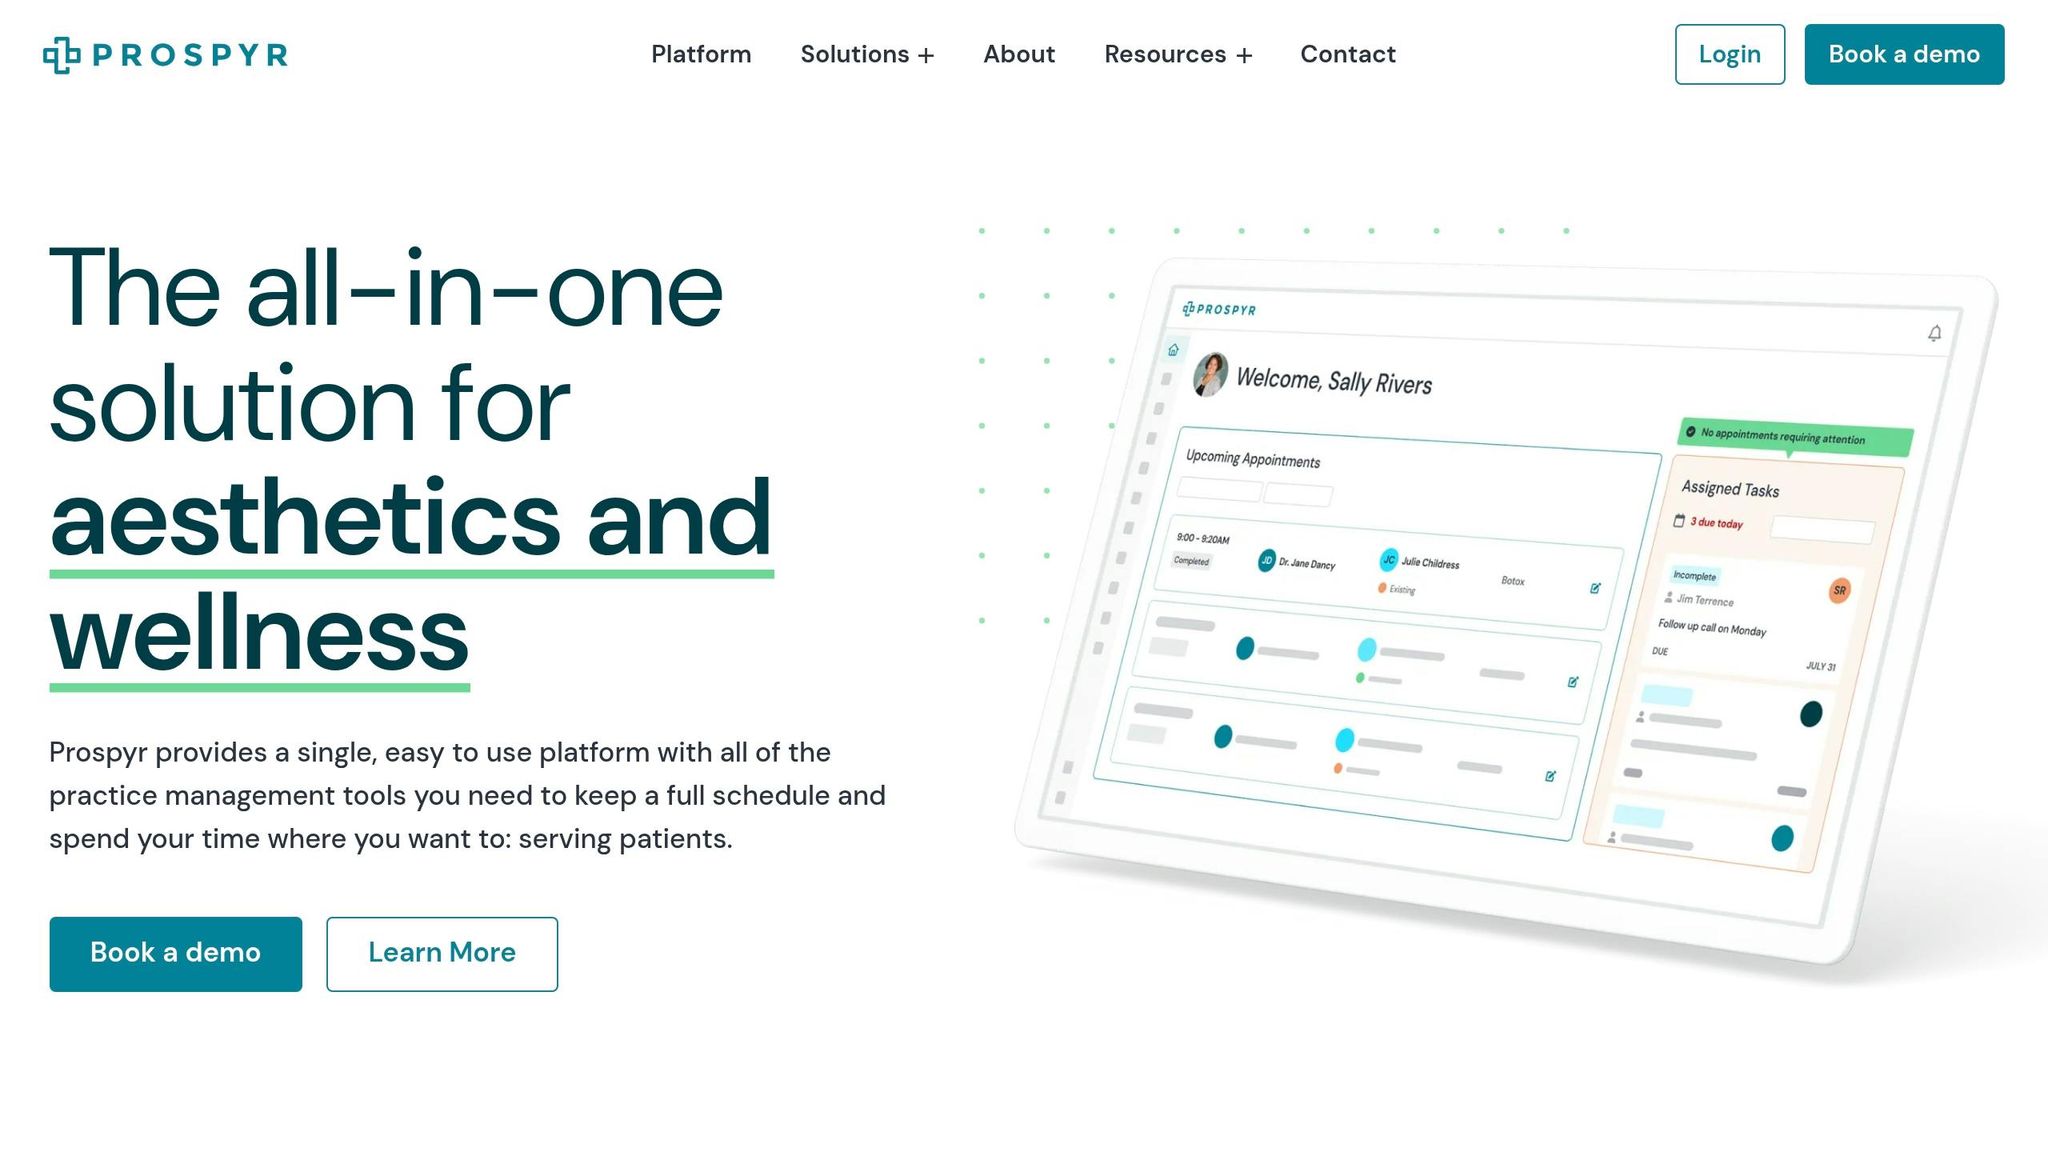
A unified platform helps turn those rules into day-to-day operations. Prospyr is a HIPAA-compliant, all-in-one practice management platform that centralizes scheduling, clinical, payment, and patient data across locations. Its real-time practice analytics give clinic owners a consistent view of utilization, rebooking, margin, and membership performance without manual pulling from multiple sources. It also supports lapsed-patient reactivation within HIPAA-compliant workflows as your group grows.
4. Turning Metrics Into Daily Clinic Workflows
Once your KPIs are set the same way across the business, the next step is simple: give each metric to the person who can move it. That's where numbers stop being something you just look at and start becoming part of daily clinic work.
Assign KPI Ownership by Team Role
Every metric needs one clear owner. Not a group. Not "the team." One person whose job includes moving that number. Without that, metrics show up in meetings, get a few nods, and then nothing changes. Clear ownership brings weak spots into the open early.
| Role | Primary KPI Ownership | Review Frequency |
|---|---|---|
| Provider | Utilization Rate, Rebooking Rate, Revenue per Hour, Avg Ticket | Weekly |
| Front Desk | No-show Rate, Cancellation Rate, Schedule Gap Rate | Daily/Weekly |
| Marketing | LTV:CAC, Cost per Kept Appointment, Lead Source ROI | Monthly |
| Location Manager | Location P&L, Reactivation Queue, Labor Cost vs. Revenue | Daily/Monthly |
| Executive/Owner | EBITDA per Room/Provider, Portfolio Retention, Margin per Service Hour | Monthly/Quarterly |
That setup turns reporting into action people can take every day.
Use Scorecards, Dashboards, and Automation to Drive Performance
A static spreadsheet checked at the end of the month is too late for a clinic that's growing. CorralData says it plainly:
"Goals set monthly and reviewed monthly mean nobody knows where they stand in the middle of the month."
A dashboard by itself doesn't fix much. It only matters if it leads to a next move. What helps is a live daily progress-to-target view that location managers review each day, so they can adjust before a small issue turns into a bad month. Provider scorecards help too, especially when they show utilization, rebooking rate, and average ticket value in one place. And ranked provider dashboards with revenue per provider per hour make performance easy to see, which makes coaching talks a lot less awkward.
Automation handles the follow-up work that often slips through the cracks. A list of patients with no future appointment booked shouldn't just sit there on a screen. It should trigger an automated daily report that lands in the manager's inbox as a call list. Prospyr supports this kind of setup with practice analytics and automated email/SMS tools, so reactivation outreach can run without someone pulling records by hand every morning. That shift turns at-risk patients into a daily work item instead of an end-of-month scramble.
Align Incentives and Coaching With the Right Metrics
Accountability works best when people can see the behavior that needs to change and repeat the behavior that works. When your data lives in one place, it's much easier to spot gaps and coach the right issue instead of criticizing everyone at once.
Incentives also need to match what each person can control. Providers tend to respond well when recognition is tied to rebooking rate, chart completion, and average ticket value. Marketing teams should be measured on kept appointments and revenue, not raw lead volume. If you reward lead count alone, you can end up spending money on channels that bring in patients who never show up. When pay and praise line up with the metrics that keep the clinic healthy, the whole system starts pulling in the same direction.
5. Running Continuous Improvement Cycles for Long-Term Performance
Turn KPI Trends Into Root-Cause Analysis
Once KPI owners and dashboards are set, use them to figure out why performance changed, especially when a KPI misses target. A falling KPI points to a problem. It does not explain the cause.
If your rebooking rate slips or no-shows start going up, the number tells you something broke. It doesn't tell you what broke. That's the job of root-cause analysis.
Two tools are especially useful here. Pareto analysis helps you spot the small set of issues causing most of the revenue loss. That might mean finding the providers, services, or locations tied to the highest cancellation rates or the biggest conversion gaps. The 5 Whys method is a good fit for day-to-day workflow issues: ask why something happened, then ask why that happened, and keep going until you get past the symptom and reach the actual cause.
| Issue | KPI to Investigate | Root Cause Indicator |
|---|---|---|
| Declining Rebooking | Days to second booking; LTV by Provider | Staff-specific relationship gaps or poor post-treatment follow-up |
| Lower Utilization | Idle time by provider; Revenue per room hour | Over-scheduling time-intensive, low-margin treatments |
| Rising No-Shows | Lead-to-book ratio by source; Follow-up response rate | Poor lead sources or weak follow-up between visits |
| Margin Erosion | Cost of Goods Sold (COGS) by service | Inventory waste, expired products, or inconsistent vendor pricing |
Use PDSA Cycles to Test and Standardize Workflow Changes
Once the cause is clear, test a single fix in one location before rolling it out everywhere. It's tempting to make the change across the whole business at once. Don't.
Use a Plan-Do-Study-Act (PDSA) cycle instead.
Pick one location. Set a clear target. Make one change, such as adjusting schedule templates, adding a rebooking prompt at checkout, or tightening lead response time. Then measure the result. If utilization or margins improve, make that workflow the standard across other locations. If not, the data shows what to change before you've disrupted the full operation.
Track these metrics across the test:
- Before the test: provider utilization, gap rate, and consumables as a percentage of revenue
- During the test: lead-to-book ratio, rebooking rate, and revenue per hour
- After standardizing: EBITDA per room and per provider, patient LTV, and churn
Conclusion: What to Measure Before You Scale Further
Scale only after the test results hold for 3 to 6 months. If you expand before your core numbers are steady, small issues turn into bigger, more expensive ones.
The signal to scale is pretty simple: provider utilization consistently between 75–85%, a rebooking rate in the 70–90% range, a gap rate under 10%, and EBITDA per provider moving toward $150,000–$350,000. Review the pattern over three to six months, not just one strong month, before you commit to a new hire, a new room, or a new location.
"Most medspas have a scheduling and margin problem, not a revenue problem." - CFO Pro Analytics
The clinics that scale well aren't the ones moving the fastest. They're the ones that know their numbers, fix the right issues first, and expand only after those thresholds are met and still holding.
FAQs
Which KPIs should I track first?
Start with KPIs that show financial health, day-to-day efficiency, and patient loyalty - not vanity metrics.
A few numbers to watch:
- Revenue per hour: aim for $850+ per treatment room
- Gross margin: target 75%+
- Patient retention rate: aim for 65%+
Prospyr can help by pulling together EMR, scheduling, and CRM data into a real-time dashboard.
How long should metrics stay stable before expanding?
Review at least 12 months of past data before you expand. That gives you a clear baseline and helps confirm that trends in patient acquisition costs, lifetime value, and operating efficiency point to steady performance, not a short-term swing.
During that same period, run monthly financial and operating reviews on a steady schedule. This helps you see whether your clinic is hitting its benchmarks and whether it’s in shape for growth.
Who should own each KPI in a clinic?
KPI ownership should line up with what each role can actually affect.
Owners and leadership usually track the big-picture financial numbers, like gross margins, net profit, and patient lifetime value. Those metrics reflect the health of the business as a whole, so they sit with the people making top-level decisions.
Practice managers or clinical leads usually own day-to-day operating metrics, such as capacity utilization, provider productivity, and schedule density. These numbers show how well the practice runs from week to week.
Individual practitioners and front-desk staff should own the metrics tied to their daily work. That includes rebooking rates, retail-to-service ratios, and accurate patient intake data. Put simply, people should be responsible for the numbers they can move.